. 1998 Jul;72(7):5517-25.
doi: 10.1128/JVI.72.7.5517-5525.1998.

Differential selection of cells with proviral c-myc and c-erbB integrations after avian leukosis virus infection

Affiliations

Differential selection of cells with proviral c-myc and c-erbB integrations after avian leukosis virus infection

M Gong et al. J Virol. 1998 Jul.

Abstract

Avian leukosis virus (ALV) infection induces bursal lymphomas in chickens after proviral integration within the c-myc proto-oncogene and induces erythroblastosis after integration within the c-erbB proto-oncogene. A nested PCR assay was used to analyze the appearance of these integrations at an early stage of tumor induction after infection of embryos. Five to eight distinct proviral c-myc integration events were amplified from bursas of infected 35-day-old birds, in good agreement with the number of transformed bursal follicles arising with these integrations. Cells containing these integrations are remarkably common, with an estimated 1 in 350 bursal cells having proviral c-myc integrations. These integrations were clustered within the 3' half of c-myc intron 1, in a pattern similar to that observed in bursal lymphomas. Bone marrow and spleen showed a similar number and pattern of integrations clustered within 3' c-myc intron 1, indicating that this region is a common integration target whether or not that tissue undergoes tumor induction. While all tissues showed equivalent levels of viral infection, cells with c-myc integrations were much more abundant in the bursa than in other tissues, indicating that cells with proviral c-myc integrations are preferentially expanded within the bursal environment. Proviral integration within the c-erbB gene was also analyzed, to detect clustered c-erbB intron 14 integrations associated with erythroblastosis. Proviral c-erbB integrations were equally abundant in the bone marrow, spleen, and bursa. These integrations were randomly situated upstream of c-erbB exon 15, indicating that cells carrying 3' intron 14 integrations must be selected during induction of erythroblastosis.


Figures

FIG. 1
FIG. 1
Map of proviral c-myc gene integrations. (A) The U5 LTR L1 and L2 and c-myc exon 2 M1 and M2 primers used for nested PCR amplification of proviral c-myc gene integrations are depicted. The asterisk represents the start site of c-myc translation. (B) The sites of proviral c-myc integration in the BK3A, 1104HI, 293S, and BK25 bursal lymphoma cell lines are depicted. The positions of the c-myc probe sequences (amplified with the M3 and M4 primers) used for Southern blot hybridization are also shown.
FIG. 2
FIG. 2
PCR amplification of proviral c-myc gene integrations. (A) Genomic DNA from bursal lymphoma cell lines was amplified in a nested PCR assay with sense LTR and antisense c-myc primers and then subjected to Southern blot hybridization with the c-myc intron 1 probe. The BK25 (lane 1) and 293S (lane 2) cell lines were assayed at 160 copies of each proviral c-myc integration, while the 1104 HI (lane 3) and BK3A (lane 4) cell lines were analyzed at 500 copies each. The size of each PCR product is indicated in base pairs. (B) Mixtures of 160 copies or 500 copies of genomic DNA from each of the four cell lines were amplified as for panel A, except that 1 μg of DNA from uninfected chicken bursa was added to each reaction mixture. The first-round PCR products were analyzed in lane 1, and the second-round PCR products were analyzed in lane 2. (C) Mixtures of DNA from the four cell lines were assayed after nested PCR amplification of 1.6 and 5 copies (lane 1), 16 and 50 copies (lane 2), or 160 and 500 copies (lane 3). All the samples were amplified in a background of 3 μg of uninfected genomic DNA. (D) Bursal genomic DNA from an ALV-infected 35-day-old bursa (bird 23) was assayed at 0.5 μg (lane 1), 1 μg (lane 2), or 3 μg (lane 3). DNA from an uninfected bird was added so that the total DNA amount amplified was 3 μg in each lane. The asterisks identify integrations used for analysis of the abundance of cells with these integrations. The migration of HindIII-digested lambda DNA molecular weight marker (M) is indicated in base pairs.
FIG. 3
FIG. 3
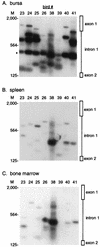
Proviral c-myc integrations in different tissues from ALV-infected birds. A 1-μg sample of genomic DNA from 35-day-old ALV-infected birds was amplified in the nested PCR assay with LTR and c-myc primers and then subjected to Southern blot hybridization with the c-myc intron 1 probe. The migration of HindIII-digested lambda DNA molecular size marker (M) is indicated in base pairs. The positions of integrations within exon 1 and intron 1 are indicated. Blots were exposed to film for 6 h. (A) Bursal DNA. The asterisk marks the 400-bp integration products that were cloned and sequenced from birds 23 and 25. (B) Spleen. (C) Bone marrow.
FIG. 4
FIG. 4
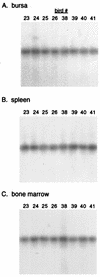
Analysis of viral infection in different tissues from ALV-infected birds. Genomic DNA (0.15 μg) from 35-day-old ALV-infected birds was amplified with LTR primers and then subjected to by Southern blot hybridization with LTR sequences. (A) Bursa. (B) Spleen. (C) Bone marrow.
FIG. 5
FIG. 5
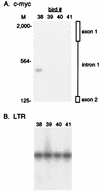
Proviral c-myc integration in brain tissue. (A) A 1-μg sample of genomic brain DNA from each of the 35-day-old ALV-infected birds was amplified in the nested PCR assay with LTR and c-myc primers and then subjected to Southern blot hybridization with the c-myc intron 1 probe. The blot was exposed to film for 6 h. The migration of HindIII-digested lambda DNA molecular size marker (M) is indicated in base pairs. (B) Genomic brain DNA (0.15 μg) was amplified with LTR primers and then subjected to Southern blot hybridization with LTR sequences.
FIG. 6
FIG. 6
PCR amplification of proviral c-erbB gene integrations. (A) Map of the c-erbB gene depicting the U5 LTR and c-erbB exon 15 primers used for nested PCR amplification of proviral c-erbB integrations. The positions of the c-erbB probe sequences (amplified with E3 and E4 primers) used for Southern blot hybridization are shown. (B) Genomic DNA (1 μg) from bird 24 bone marrow was amplified in a nested PCR assay with sense LTR and antisense c-erbB primers and then subjected to Southern blot hybridization with the c-erbB probe. First-round PCR for both samples used primers L1 and E1. The migration of HindIII-digested lambda DNA molecular size marker (M) is indicated in base pairs. The positions of the integrations within intron 14 and exon 14 are indicated. Lanes: 1, second-round PCR with primers L2 and E2; 2, second-round PCR with primers L2 and E3.
FIG. 7
FIG. 7
Proviral c-erbB integrations in different tissues from ALV-infected birds. Genomic DNA (2.5 μg) from 35-day-old ALV-infected birds was amplified in the nested PCR assay with LTR L1 and L2 and c-erbB E1 and E2 primers and then subjected to Southern blot hybridization with the c-erbB intron 14 probe. The migration of molecular size markers (M) is shown in base pairs. The blots were exposed to film for 25 min. The migration of HindIII-digested lambda DNA molecular size marker (M) is indicated in base pairs. (A) Spleen. (B) Bone marrow. (C) Bursa.
FIG. 8
FIG. 8
Map of proviral c-myc integration sites in tumors and in infected tissues. (A) The sites of proviral c-myc integration in ALV-induced tumors are summarized from Shih et al. (44) and Robinson and Gagnon (41). (B) Integration sites in infected bursa, mapped with data from Fig. 3A. (C) Integration sites in infected spleen tissues, with data from Fig. 3B. (D) Integration sites in infected bone marrow, with data from Fig. 3C. (E) Structural features of the c-myc gene. Arrows represent DNase I-hypersensitive sites. Bars represent AT-rich sequences. The 350-bp 3′ exon 1, 5′ intron 1, and 3′ intron 1 regions used to analyze integration frequencies in Table 1 are outlined.

Similar articles

Cited by

References

    1. Ausubel F M, Brent R, Kingston R E, Moore D D, Seidman J G, Smith J A, Struhl K, editors. Current protocols in molecular biology. New York, N.Y: John Wiley & Sons, Inc.; 1994.
    1. Baba T W, Humphries E H. Formation of a transformed follicle is necessary but not sufficient for development of an avian leukosis virus-induced lymphoma. Proc Natl Acad Sci USA. 1985;82:213–216. - PMC - PubMed
    1. Belli B, Wolff L, Nazarov V, Fan H. Proviral activation of the c-myc proto-oncogene is detectable in preleukemic mice infected neonatally with Moloney murine leukemia virus but not in resulting end-stage T lymphomas. J Virol. 1995;69:5138–5141. - PMC - PubMed
    1. Bizub D, Katz R A, Skalka A M. Nucleotide sequence of noncoding regions in Rous-associated virus-2: comparisons delineate conserved regions important in replication and oncogenesis. J Virol. 1984;49:557–565. - PMC - PubMed
    1. Bloom S E, Delany M E, Muscarella D E. Constant and variable features of avian chromosomes. In: Etches R J, Gibbons A M V, editors. Manipulation of the avian genome. Boca Raton, Fla: CRC Press, Inc.; 1993. pp. 39–60.

Publication types