. 1998 Jul;72(7):5545-51.
doi: 10.1128/JVI.72.7.5545-5551.1998.

Modulation of viral immunoinflammatory responses with cytokine DNA administered by different routes

Affiliations

Modulation of viral immunoinflammatory responses with cytokine DNA administered by different routes

S Chun et al. J Virol. 1998 Jul.

Abstract

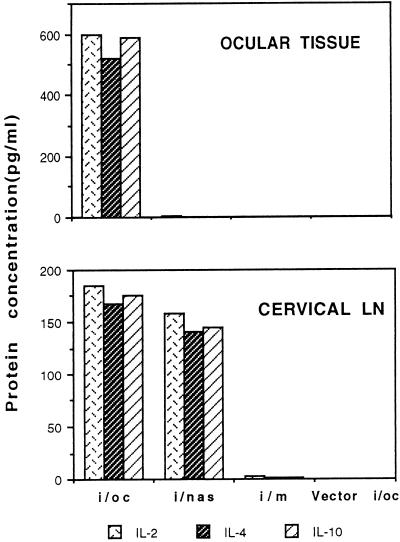
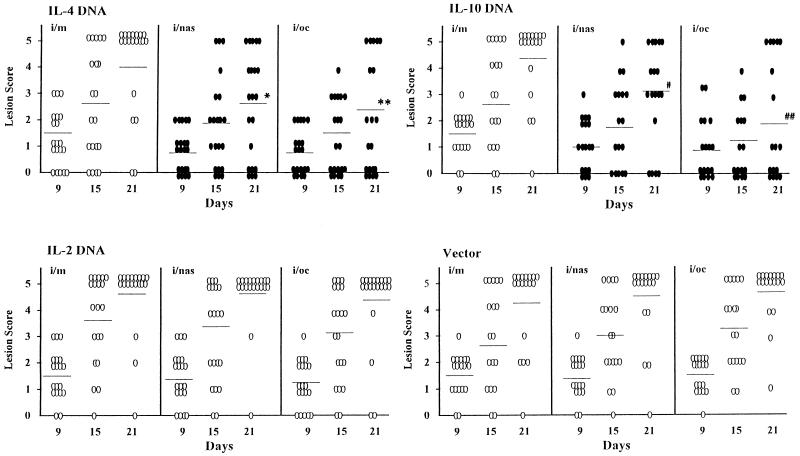
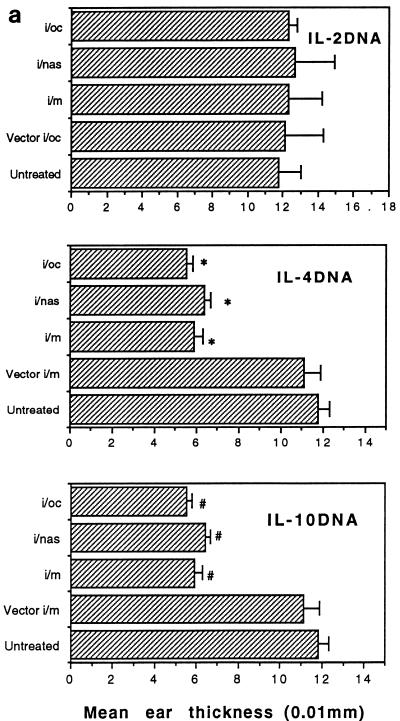
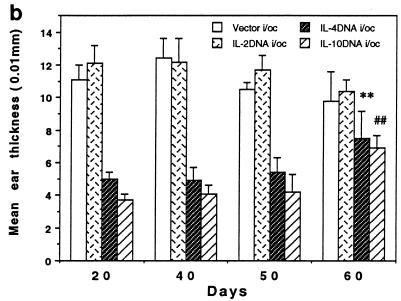
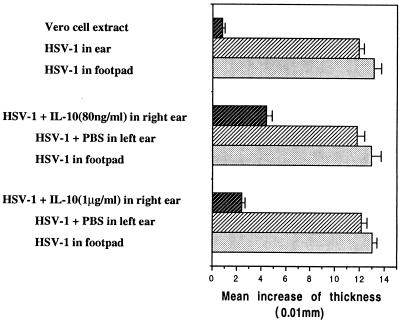
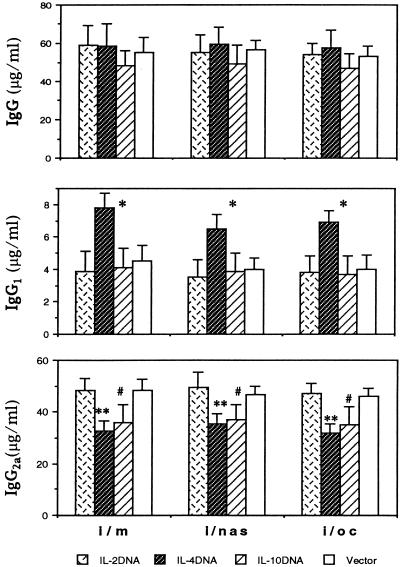
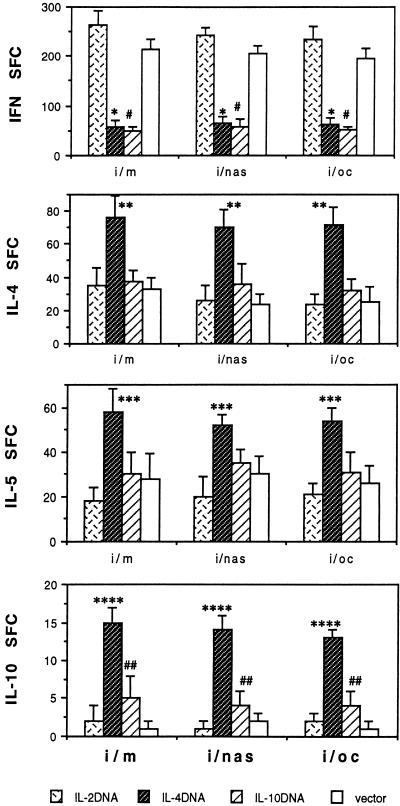
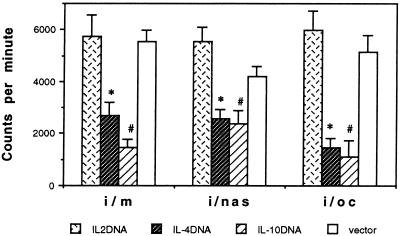
The efficacy of plasmid DNA encoding cytokine administered by different routes, systemic or surface exposure, was evaluated and compared for their modulating effects on subsequent lesions caused by infection with herpes simplex virus (HSV). Systemic or topical administration of both interleukin-4 (IL-4) and IL-10 DNA but not IL-2 DNA caused a long-lasting suppression of HSV-specific delayed-type hypersensitivity response. IL-4 or IL-10 DNA preadministration also modulated the expression of immunoinflammatory lesions associated with corneal infection of HSV. Suppression of ocular lesions required that the DNA be administered to the nasal mucosa or ocular surfaces and was not evident after intramuscular administration. The modulating effect of IL-10 DNA was most evident after topical ocular administration, whereas the effects of IL-4 DNA given by both routes appeared to be equal. Preexposure of IL-4 DNA, but not IL-10 DNA, resulted in a significant change in Th subset balance following HSV infection. Our results indicate that the modulating effect of IL-4 or IL-10 DNA may proceed by different mechanisms. Furthermore, our results suggest that surface administration of cytokine DNA is a convenient means of modulating immunoinflammatory lesions.


Figures

FIG. 1
FIG. 1
Expression of cytokine in vivo. To assess cytokine protein expression in vivo, each BALB/c mouse was given 100 μg of plasmid DNA encoding either IL-2, IL-4, or IL-10 administered either i.m., i.n., or i.o. Three days later, the corneas and cervical LN were pooled separately in DMEM with 10% FBS and frozen at −80°C. Following the tissues were thawed, they were homogenized and sonicated. After centrifugation, the supernatants were analyzed for either IL-2, IL-4, or IL-10 by ELISA. Protein expression in corneas and in cervical LN is shown. Additionally, skeletal muscles and popliteal LN were isolated and analyzed for expression of each protein. The expression of cytokines was identified in the muscle and popliteal LN following i.m. administration. The graphs represent one of two independent experiments which showed similar results. Abbreviations: i/oc, intraocular; i/nas, intranasal; i/m, intramuscular.
FIG. 2
FIG. 2
Effect of prophylactic cytokine DNA administration on the severity of ocular inflammation (HSK). Groups of animals were given plasmid DNA encoding either IL-2, IL-4, or IL-10, or vector administered i.m., i.n., or i.o. on three occasions at weekly intervals. On the day after the last treatment, the corneas were challenged with 106 PFU of HSV-1 RE, as described in Materials and Methods. The animals were clinically observed at various time points p.i. for development of HSK. Each score in the graph is for one eye. The graph shows the results of one of two independent experiments with similar results. The total number (n) of mice used in each treatment group follows: IL-2 DNA i.m. (n = 38), IL-2 DNA i.n. (n = 40), IL-2 DNA i.o. (n = 40), IL-4 DNA i.m. (n = 34), IL-4 DNA i.n. (n = 52), IL-4 DNA i.o. (n = 52), IL-10 DNA i.m. (n = 38), IL-10 DNA i.n. (n = 38), IL-10 DNA i.o. (n = 34), vector DNA i.m. (n = 36), vector DNA i.n. (n = 36), and vector DNA i.o. (n = 36). Mean values are indicated by short horizontal lines. Values that are statistically significantly different (P < 0.05) from the values for mice treated with vector or IL-2 DNA are indicated by ∗, ∗∗, #, and ## symbols. Values that are not statistically significantly different (P > 0.05) between groups (∗ versus ∗∗) and values that are statistically significant different (P < 0.05) between groups (# versus ##) are indicated. Abbreviations: i/m, intramuscular; i/nas, intranasal; i/oc, intraocular.
FIG. 3
FIG. 3
Suppression of HSV-specific DTH response after prophylactic administration of plasmid DNAs encoding cytokines. Groups of mice were treated with plasmid DNA encoding IL-2, IL-4, or IL-10 administered i.m., i.n., or i.o. or with vector on three occasions at weekly intervals and infected with 106 PFU of HSV-1 RE ocularly the day after the last DNA administration. On day 18 following HSV infection, these mice were challenged with 20 μl of HSV-1 KOS (105 PFU prior to UV inactivation) or Vero cell extract in the right or left ear pinna, respectively. Forty-eight hours later, the increase in ear thickness was measured as described in Materials and Methods (a). On days 38, 48, and 58, the mice were challenged, and DTH responses were measured 48 h later (b). Similar results were found in i.m. and i.n. groups. Each bar shows the mean difference between the thickness of left and right ear pinna ± standard deviation (error bar) 48 h after challenge. Each group contains at least 10 mice. Values that are statistically significantly different from the values for mice treated with vector are indicated as follows: ∗, #, and ## (P < 0.01) and ∗∗ (P > 0.05) at day 60. Abbreviations: i/oc, intraocular; i/nas, intranasal; i/m, intramuscular.
FIG. 3
FIG. 3
Suppression of HSV-specific DTH response after prophylactic administration of plasmid DNAs encoding cytokines. Groups of mice were treated with plasmid DNA encoding IL-2, IL-4, or IL-10 administered i.m., i.n., or i.o. or with vector on three occasions at weekly intervals and infected with 106 PFU of HSV-1 RE ocularly the day after the last DNA administration. On day 18 following HSV infection, these mice were challenged with 20 μl of HSV-1 KOS (105 PFU prior to UV inactivation) or Vero cell extract in the right or left ear pinna, respectively. Forty-eight hours later, the increase in ear thickness was measured as described in Materials and Methods (a). On days 38, 48, and 58, the mice were challenged, and DTH responses were measured 48 h later (b). Similar results were found in i.m. and i.n. groups. Each bar shows the mean difference between the thickness of left and right ear pinna ± standard deviation (error bar) 48 h after challenge. Each group contains at least 10 mice. Values that are statistically significantly different from the values for mice treated with vector are indicated as follows: ∗, #, and ## (P < 0.01) and ∗∗ (P > 0.05) at day 60. Abbreviations: i/oc, intraocular; i/nas, intranasal; i/m, intramuscular.
FIG. 4
FIG. 4
Effect of IL-10 protein on cutaneous DTH responses. Groups of mice were immunized with HSV-1, and 25 days later, the animals were challenged with 20 μl of HSV-1 KOS (105 PFU before UV inactivation) and IL-10 protein and with 20 μl of HSV-1 in the right ear and left ears, respectively. For the control group, mice were injected with 20 μl of HSV-1 and Vero cell extract in the right and left ears, respectively. For the footpad swelling, the same mice were challenged with 20 μl of HSV-1 and Vero cell extract in the right and left footpads, respectively. Forty-eight hours later, the increase in ear or footpad thickness was measured as described in Materials and Methods. Each bar shows the mean increase in thickness ± standard deviation (error bar) 48 h after challenge.
FIG. 5
FIG. 5
Effect of prophylactic administration of cytokine DNAs on humoral immune responses. Serum samples from mice given plasmid DNA encoding cytokines were collected at day 21 p.i. and individually analyzed for HSV-specific antibody responses as described in Materials and Methods. Each group consisted of 10 to 14 mice. Values that are statistically significantly different (∗ and ∗∗) (P < 0.05) (IL-4 DNA versus IL-2 DNA or vector) and values that are not statistically not significant (#) (0.05 < P < 0.1) (IL-10 DNA versus IL-2 DNA or vector) are indicated. Abbreviations: i/m, intramuscular; i/nas, intranasal; i/oc, intraocular.
FIG. 6
FIG. 6
Effect of prophylactic administration of cytokine DNAs on SFC. Approximately 21 days p.i., splenocytes from two mice of each group were pooled and restimulated in vitro for 4 days with enriched DC cells that were either naive or pulsed with UV-inactivated HSV (MOI of 5 before UV inactivation). Frequencies of cytokine-producing cells were measured by the ELISPOT assay. The number of SFC after naive DC restimulation are subtracted from the values of UV-inactivated HSV-pulsed DC restimulation. The graphs show means and standard deviations from four independent experiments. Values that are statistically significantly different are indicated as follows: ∗ and #, IL-4 DNA or IL-10 DNA versus vector (P < 0.01); ∗∗ and ∗∗∗, IL-4 DNA versus vector (P < 0.05); ∗∗∗∗, IL-4 DNA versus vector (P < 0.01); ##, IL-10 DNA versus vector (0.05 < P < 0.01). Abbreviations: i/m, intramuscular; i/nas, intranasal; i/oc, introcular.
FIG. 7
FIG. 7
Effect of prophylactic cytokine DNA administration on HSV-specific lymphoproliferation. Approximately 21 days p.i., splenocytes from two mice of each group were pooled and used as responders for proliferation. These responders were mixed with irradiated syngenic spleen cells infected with UV-inactivated HSV (MOI of 1.5 before UV inactivation) or irradiated naive splenocytes, and incubated for 5 days as described in Materials and Methods. The graph shows responder plus irradiated UV-inactivated HSV-pulsed syngenic splenocytes and shows the results of one of five independent experiments with similar results. The values for IL-4 DNA and IL-10 DNA compared to vector were significantly different (P < 0.01) (∗ and #). Proliferation index (PI) was also calculated (15), and the proliferation index for each treatment group follows: IL-2 DNA i.m., 11.5; IL-2 DNA i.n., 14.3; IL-2 DNA i.o., 16.5; IL-4 DNA i.m., 5.1; IL-4 DNA i.n., 6.1; IL-4 DNA i.o., 3.9; IL-10 DNA i.m., 3.2; IL-10 DNA i.n., 5.7; IL-10 DNA i.o., 2.8; vector i.m., 10.4; vector i.n., 10.2; vector i.o., 13.5. Abbreviations: i/m, intramuscular; i/nas, intranasal; i/oc, intraocular.

References

    1. Chow Y-H, Chiang B-L, Lee Y-L, Chi W-K, Liu W-C, Chen Y-T, Tao M-H. Development of Th1 and Th2 populations and the nature of immune responses to hepatitis B virus DNA vaccines can be modulated by codelivery of various cytokine genes. J Immunol. 1998;160:1320–1329. - PubMed
    1. Daheshia M, Kuklin N, Kanangat S, Manickan E, Rouse B T. Suppression of ongoing ocular inflammatory disease by topical administration of plasmid DNA encoding IL-10. J Immunol. 1997;159:1945–1952. - PubMed
    1. Daheshia, M., N. Kuklin, E. Manickan, S. Chun, and B. T. Rouse. Immune induction and modulation by topical ocular administration of plasmid DNA encoding antigens and cytokines. Vaccine, in press. - PubMed
    1. Ertl H C J, Xiang Z. Novel DNA vaccine approaches. J Immunol. 1996;156:3579–3582. - PubMed
    1. Groux H, O’Garra A, Bigler M, Rouleau M, Antonenko S, de Vries J E, Roncarolo M G. A CD4+ T cell subset inhibits antigen-specific T cell responses and prevents colitis. Nature. 1997;389:737–742. - PubMed

Publication types