. 1998 Jul;72(7):6065-72.
doi: 10.1128/JVI.72.7.6065-6072.1998.

Structure and phylogenetic analysis of an endogenous retrovirus inserted into the human growth factor gene pleiotrophin

Affiliations

Structure and phylogenetic analysis of an endogenous retrovirus inserted into the human growth factor gene pleiotrophin

A M Schulte et al. J Virol. 1998 Jul.

Abstract

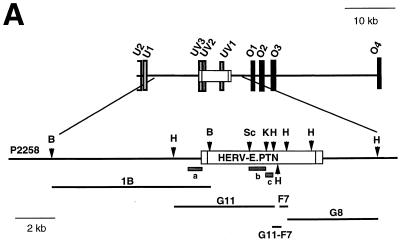
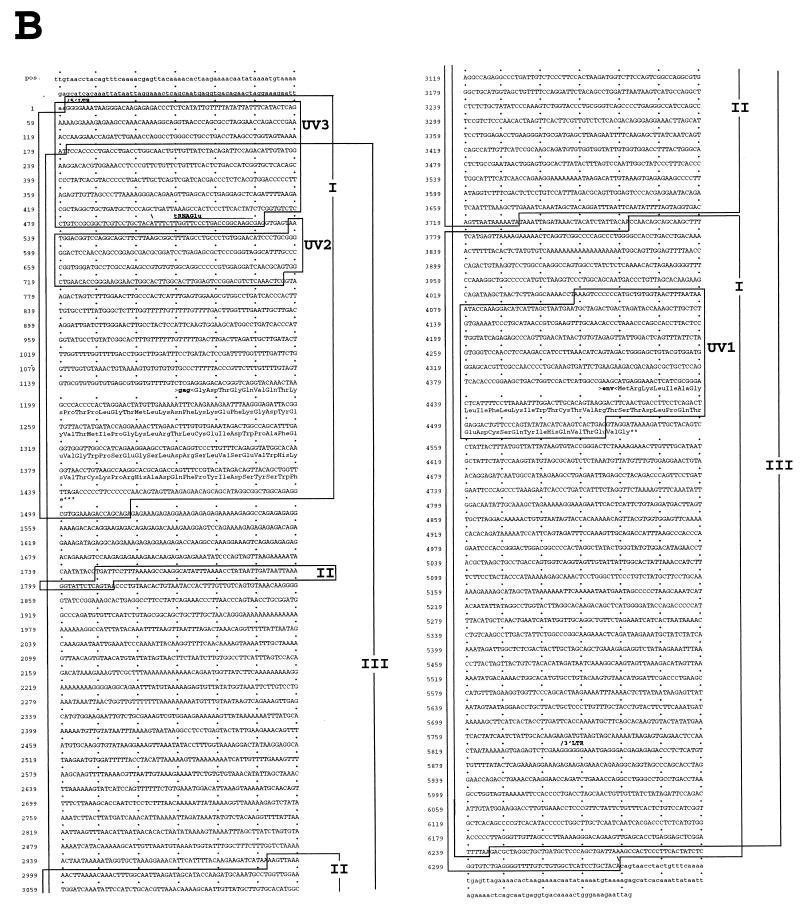
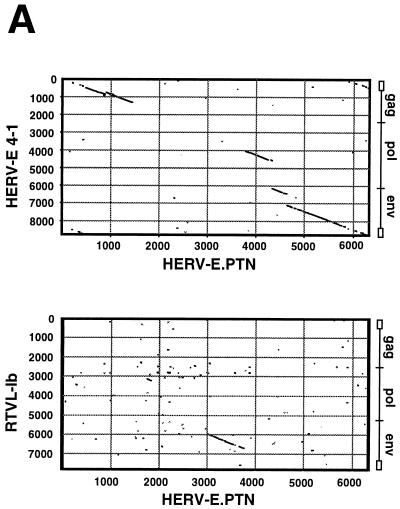
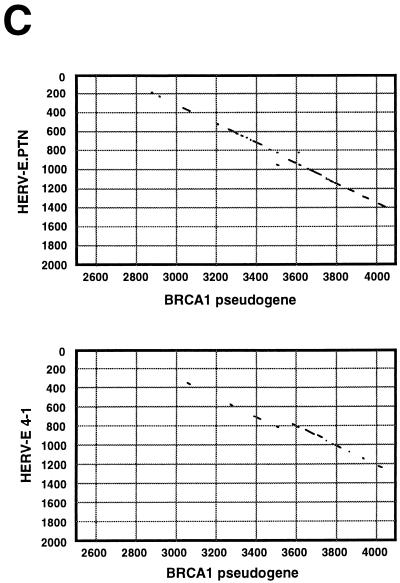
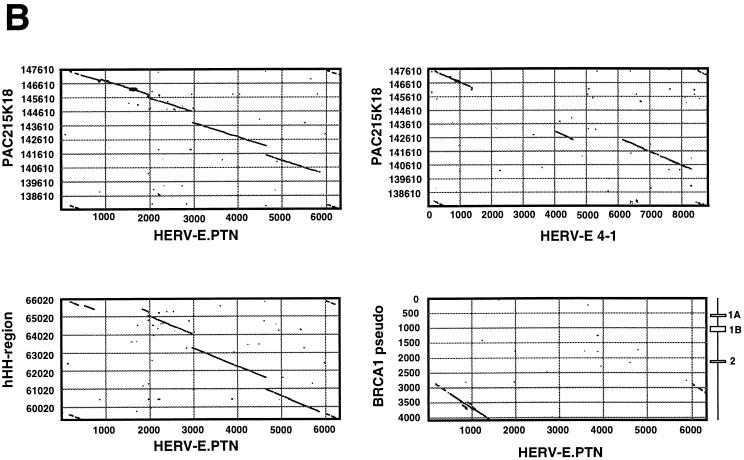
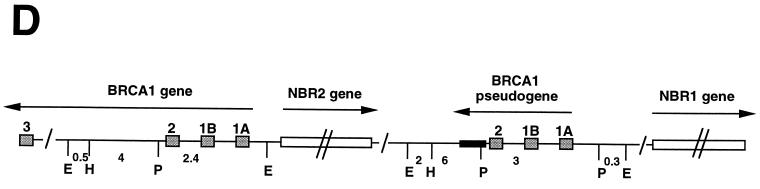
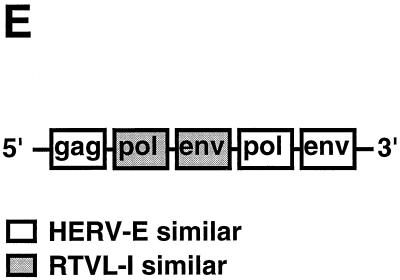
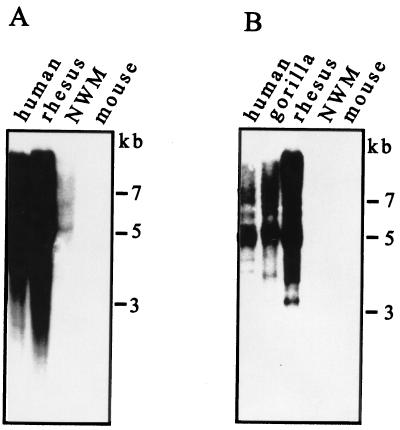
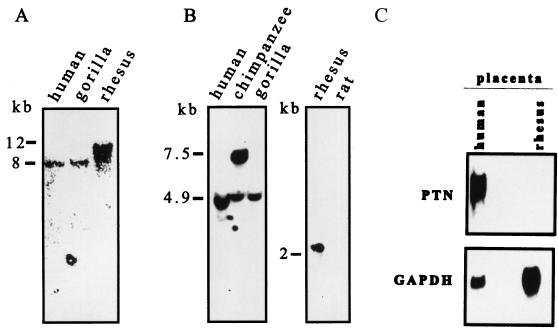
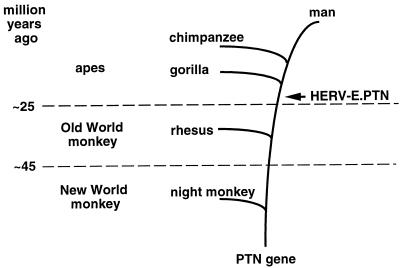
A human endogenous retrovirus-like element (HERV), flanked by long terminal repeats of 502 and 495 nucleotides is inserted into the human pleiotrophin (PTN) gene upstream of the open reading frame. Based on its Glu-tRNA primer binding site specificity and the location within the PTN gene, we named this element HERV-E.PTN. HERV-E.PTN appears to be a recombined viral element based on its high homology (70 to 86%) in distinct areas to members of two distantly related HERV type C families, HERV-E and retrovirus-like element I (RTVL-I). Furthermore, its pseudogene region is organized from 5' to 3' into gag-, pol-, env-, pol-, env-similar sequences. Interestingly, full-length and partial HERV-E.PTN-homologous sequences were found in the human X chromosome, the human hereditary haemochromatosis region, and the BRCA1 pseudogene. Finally, Southern analyses indicate that the HERV-E.PTN element is present in the PTN gene of humans, chimpanzees, and gorillas but not of rhesus monkeys, suggesting that genomic insertion occurred after the separation of monkeys and apes about 25 million years ago.


Figures

FIG. 1
FIG. 1
Organization of the human PTN gene, location of the HERV- E.PTN, its complete sequence, and homologies. (A) Mapping and partial restriction map of the HERV- E.PTN. The PTN open reading frame exons (O1 to O4), 5′ untranslated region exons (U1 and U2), HERV- derived exons (UV1 to UV3), and HERV element are boxed. The characterized region of the P1 clone P2258, the BamHI (1B) and HindIII (G11, F7, and G8) subclones, and the PCR clone (G11-F7) is enlarged. The genomic Southern blot probes (a, b, and c) and restriction sites are shown (B, BamHI; H, HindIII; Sc, ScaI; K, KpnI). (B) Nucleotide sequence of HERV- E.PTN and its homology to other ERVs. The 6,337-nt HERV- E.PTN is numbered continuously from 5′ to 3′, the flanking sequences are shown in lowercase letters, the LTRs are labelled and marked at their borders, and the putative tRNAGlu primer-binding site is shown. The short translated amino acid sequences similar to Gag and Env fragments are shown beneath the nucleotide sequence (∗∗∗, stop codons). The HERV- derived exons of the human PTN gene are boxed (UV3, UV2, and UV1). Boxed regions I, II, and III are similar to other GenBank entries (I, HERV- E; II, RTVL-I; III, X-chromosome PAC clone 215K18 and hHH region) as discussed in the text. The 5′ end of the HERV- E.PTN sequence corresponds to position −11267 in reference . (C) Comparison of the LTR sequences. Dots represent identity, dashes indicate spacing introduced for optimal alignment, and differing nucleotides are indicated. Putative U3, R, and U5 regions (boundaries are indicated by ‡), the putative retroviral TATA box (ATTTTAA) and polyadenylation signal (ATTAAA), and the tRNAGlu primer-binding sites downstream of the 5′ LTR are shown. (D) HERV- E.PTN flanking sequences. The underlined nucleotides indicate the predicted TATA boxes of the HERV- derived promoter of the human PTN gene and the defined transcription start site of the HERV- PTN fusion transcript.
FIG. 1
FIG. 1
Organization of the human PTN gene, location of the HERV- E.PTN, its complete sequence, and homologies. (A) Mapping and partial restriction map of the HERV- E.PTN. The PTN open reading frame exons (O1 to O4), 5′ untranslated region exons (U1 and U2), HERV- derived exons (UV1 to UV3), and HERV element are boxed. The characterized region of the P1 clone P2258, the BamHI (1B) and HindIII (G11, F7, and G8) subclones, and the PCR clone (G11-F7) is enlarged. The genomic Southern blot probes (a, b, and c) and restriction sites are shown (B, BamHI; H, HindIII; Sc, ScaI; K, KpnI). (B) Nucleotide sequence of HERV- E.PTN and its homology to other ERVs. The 6,337-nt HERV- E.PTN is numbered continuously from 5′ to 3′, the flanking sequences are shown in lowercase letters, the LTRs are labelled and marked at their borders, and the putative tRNAGlu primer-binding site is shown. The short translated amino acid sequences similar to Gag and Env fragments are shown beneath the nucleotide sequence (∗∗∗, stop codons). The HERV- derived exons of the human PTN gene are boxed (UV3, UV2, and UV1). Boxed regions I, II, and III are similar to other GenBank entries (I, HERV- E; II, RTVL-I; III, X-chromosome PAC clone 215K18 and hHH region) as discussed in the text. The 5′ end of the HERV- E.PTN sequence corresponds to position −11267 in reference . (C) Comparison of the LTR sequences. Dots represent identity, dashes indicate spacing introduced for optimal alignment, and differing nucleotides are indicated. Putative U3, R, and U5 regions (boundaries are indicated by ‡), the putative retroviral TATA box (ATTTTAA) and polyadenylation signal (ATTAAA), and the tRNAGlu primer-binding sites downstream of the 5′ LTR are shown. (D) HERV- E.PTN flanking sequences. The underlined nucleotides indicate the predicted TATA boxes of the HERV- derived promoter of the human PTN gene and the defined transcription start site of the HERV- PTN fusion transcript.
FIG. 2
FIG. 2
(A) Dot plot matrix analysis of HERV- E.PTN relative to sequences from the HERV- E clone 4-1 and RTVL-Ib. The x axis shows HERV- E.PTN; the y axes show HERV- E clone 4-1 (GenBank accession no. K02168) and RTVL-Ib (GenBank accession no. M92068). Window size, 30; hash value, 2; homology, 70%. The organization of the pseudogene region of the HERV- E clone 4-1 and the RTVL-Ib is indicated on the right ordinate. (B) Dot plot matrix analysis of HERV- E.PTN relative to sequences from the human X-chromosome PAC clone 215K18, the hHH region, and the BRCA1 pseudogene, and dot plot matrix analysis of HERV- E clone 4-1 relative to the sequence from the human X chromosome PAC clone 215K18. The x axis shows HERV- E.PTN or HERV- E clone 4-1 (Genbank accession no. K02168); the y axes show HERV- E clone 4-1, RTVL-Ib (GenBank accession no. M92068), PAC 215K18 (GenBank accession no. Z83820), hHH region (GenBank accession no. U91328), and BRCA1 pseudogene (GenBank accession no. U77841). Window size, 30; hash value, 2; homology, 70%. The organization of the BRCA1 pseudogene is indicated on the right ordinate. (C) Dot plot matrix analysis of the BRCA1 pseudogene relative to HERV- E.PTN and HERV- E clone 4-1. The x axis shows the BRCA1 pseudogene (GenBank accession no. U77841; positions 2500 to 4098); the y axes show HERV- E.PTN (positions 1 to 2000) and HERV- E clone 4-1 (positions 1 to 2000). Window size, 30; hash value, 2; homology, 90%. (D) The HERV- E.PTN-homologous region in the BRCA1 locus. Arrows represent the direction of transcription, shaded boxes represent exons from BRCA1 and pseudo-BRCA1 genes (1A, 1B, 2, and 3), open boxes symbolize the NBR2 (next to BRCA1 gene 2; formerly known as pseudogene 1A1-3B [∼30 kb]) and NBR1 (formerly known as gene 1A1-3B) genes. The solid box represents the recently sequenced HERV- E.PTN-homologous region (1,243 nt) in the pseudo-BRCA1 gene. The genomic organization, restriction enzyme sites (E, EcoRI; H, HindIII; P, PstI), and size (kilobases) of restriction fragments are adapted from references and . This diagram is not drawn to scale. (E) Diagram of the structure of HERV- E.PTN based on retroviral pseudogenes.
FIG. 2
FIG. 2
(A) Dot plot matrix analysis of HERV- E.PTN relative to sequences from the HERV- E clone 4-1 and RTVL-Ib. The x axis shows HERV- E.PTN; the y axes show HERV- E clone 4-1 (GenBank accession no. K02168) and RTVL-Ib (GenBank accession no. M92068). Window size, 30; hash value, 2; homology, 70%. The organization of the pseudogene region of the HERV- E clone 4-1 and the RTVL-Ib is indicated on the right ordinate. (B) Dot plot matrix analysis of HERV- E.PTN relative to sequences from the human X-chromosome PAC clone 215K18, the hHH region, and the BRCA1 pseudogene, and dot plot matrix analysis of HERV- E clone 4-1 relative to the sequence from the human X chromosome PAC clone 215K18. The x axis shows HERV- E.PTN or HERV- E clone 4-1 (Genbank accession no. K02168); the y axes show HERV- E clone 4-1, RTVL-Ib (GenBank accession no. M92068), PAC 215K18 (GenBank accession no. Z83820), hHH region (GenBank accession no. U91328), and BRCA1 pseudogene (GenBank accession no. U77841). Window size, 30; hash value, 2; homology, 70%. The organization of the BRCA1 pseudogene is indicated on the right ordinate. (C) Dot plot matrix analysis of the BRCA1 pseudogene relative to HERV- E.PTN and HERV- E clone 4-1. The x axis shows the BRCA1 pseudogene (GenBank accession no. U77841; positions 2500 to 4098); the y axes show HERV- E.PTN (positions 1 to 2000) and HERV- E clone 4-1 (positions 1 to 2000). Window size, 30; hash value, 2; homology, 90%. (D) The HERV- E.PTN-homologous region in the BRCA1 locus. Arrows represent the direction of transcription, shaded boxes represent exons from BRCA1 and pseudo-BRCA1 genes (1A, 1B, 2, and 3), open boxes symbolize the NBR2 (next to BRCA1 gene 2; formerly known as pseudogene 1A1-3B [∼30 kb]) and NBR1 (formerly known as gene 1A1-3B) genes. The solid box represents the recently sequenced HERV- E.PTN-homologous region (1,243 nt) in the pseudo-BRCA1 gene. The genomic organization, restriction enzyme sites (E, EcoRI; H, HindIII; P, PstI), and size (kilobases) of restriction fragments are adapted from references and . This diagram is not drawn to scale. (E) Diagram of the structure of HERV- E.PTN based on retroviral pseudogenes.
FIG. 3
FIG. 3
Southern blot hybridization of BamHI-digested genomic DNA with a probe corresponding to the RTVL-I env-similar region (probe b, Fig. 1A). (A) Low-stringency wash (20 μg of DNA). (B) High-stringency wash (10 μg of human and gorilla DNA; 20 μg of rhesus monkey, night monkey [NWM], and mouse DNA).
FIG. 4
FIG. 4
HERV- E.PTN is localized in the human, chimpanzee, and gorilla PTN gene. Southern analysis with BamHI-digested (A) or HindIII-digested (B) genomic DNA with a probe corresponding to the sequence upstream of the HERV- E.PTN plus 30 nt of 5′ LTR sequence (probe a, Fig. 1A) is shown. Loading: 10 μg of human DNA in panel A, 20 μg in panel B; 10 μg of gorilla DNA in panel A, 20 μg in panel B; 20 μg of rhesus monkey DNA; 20 μg of chimpanzee DNA; 20 μg of rat DNA. (C) Northern analysis with 20 μg of total RNA from human placenta and 10 μg of poly(A)+ RNA from rhesus monkey placenta.
FIG. 5
FIG. 5
Evolutionary tree and proposed time point of the HERV- E.PTN insertion into the PTN gene.

Similar articles

Cited by

References

    1. Andrake M D, Skalka A M. Retroviral integrase, putting the pieces together. J Biol Chem. 1996;271:19633–19636. - PubMed
    1. Bloch B, Normand E, Kovesdi I, Böhlen P. Expression of the HBNF (heparin-binding neurite-promoting factor) gene in the brain of fetal, neonatal and adult rat: an in situ hybridization study. Dev Brain Res. 1992;70:267–278. - PubMed
    1. Brown M A, Chun-Fang X, Nicolai H, Griffiths B, Chambers J A, Black D, Solomon E. The 5′-end of the BRCA1 gene lies within a duplicated region of human chromosome 17q21. Oncogene. 1996;12:2507–2513. - PubMed
    1. Chauhan A K, Li Y S, Deuel T F. Pleiotrophin transforms NIH3T3 cells and induces tumors in nude mice. Proc Natl Acad Sci USA. 1993;90:679–682. - PMC - PubMed
    1. Chen H R, Barker W C. Nucleotide sequences of the retroviral long terminal repeats and their adjacent regions. Nucleic Acids Res. 1984;12:1767–1778. - PMC - PubMed

Publication types

Associated data

LinkOut - more resources