. 1998 Jun;117(2):501-13.
doi: 10.1104/pp.117.2.501.

Auxin deprivation induces synchronous Golgi differentiation in suspension-cultured tobacco BY-2 cells

Affiliations

Auxin deprivation induces synchronous Golgi differentiation in suspension-cultured tobacco BY-2 cells

Z M Winicur et al. Plant Physiol. 1998 Jun.

Abstract

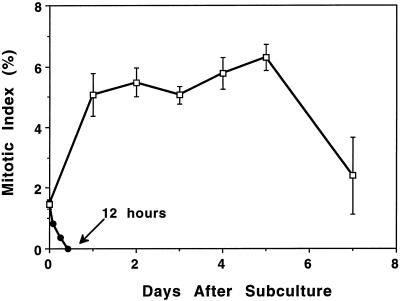
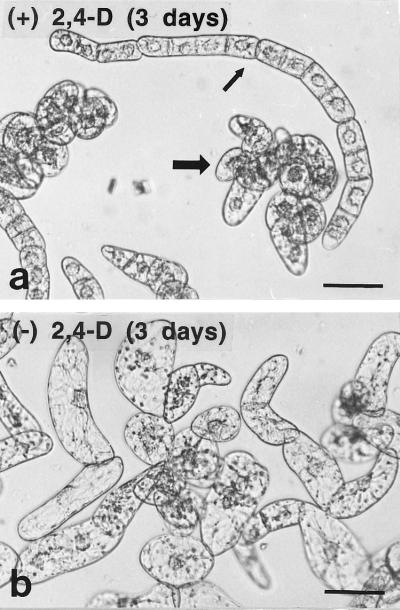
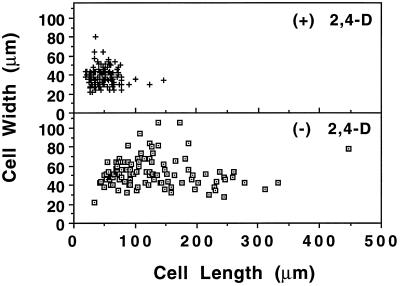
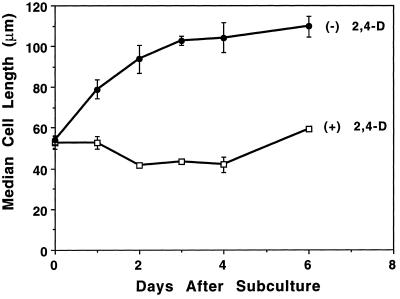
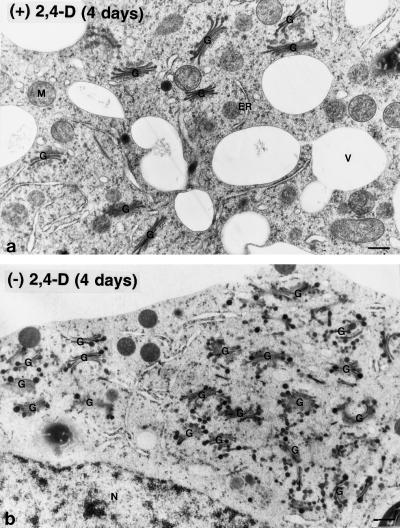
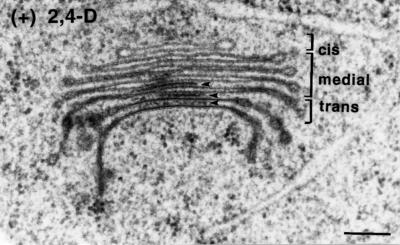
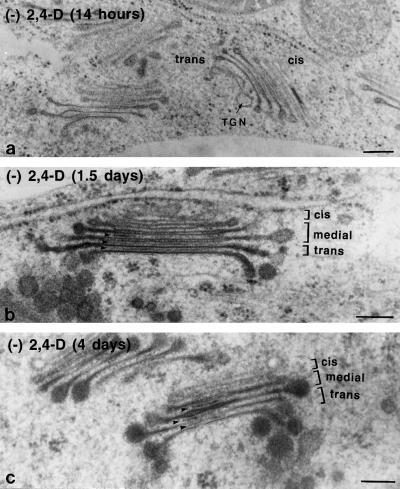
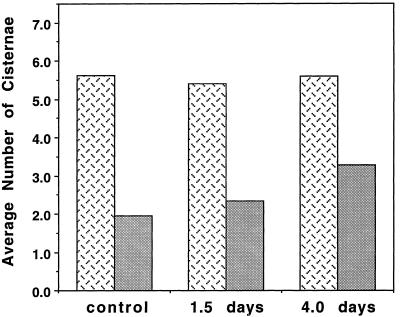
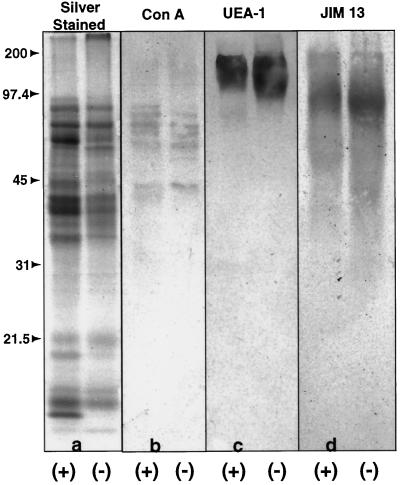
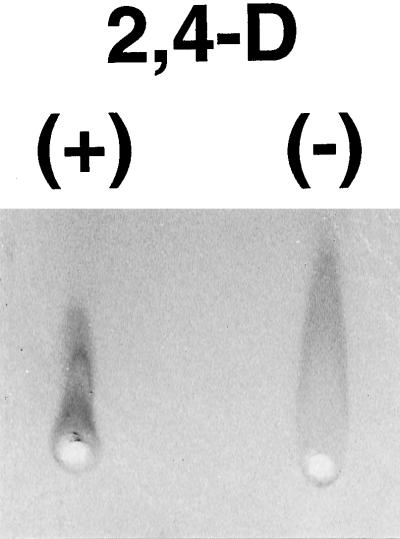
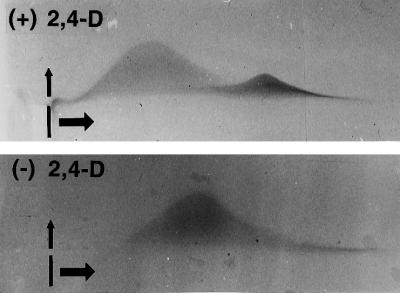
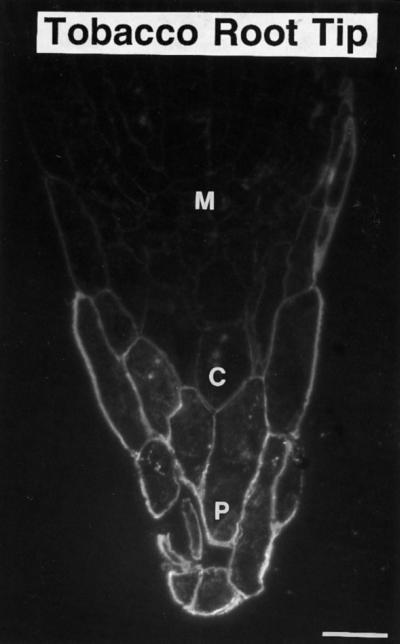
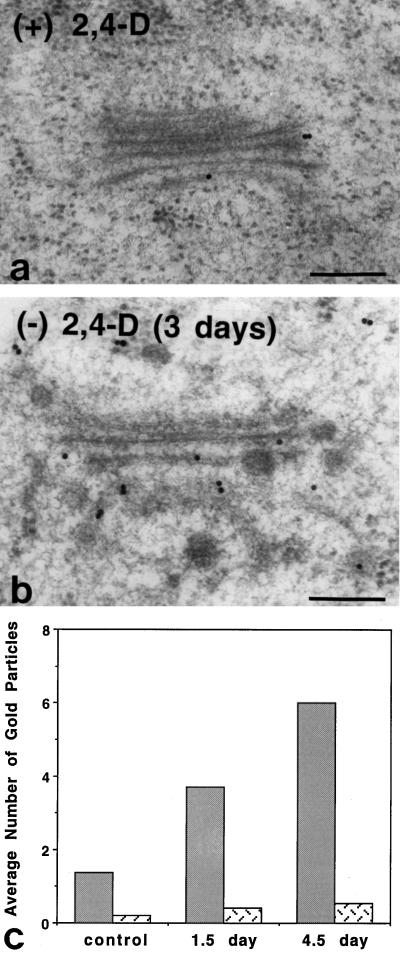
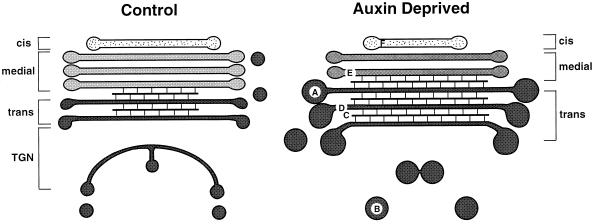
To date, the lack of a method for inducing plant cells and their Golgi stacks to differentiate in a synchronous manner has made it difficult to characterize the nature and extent of Golgi retailoring in biochemical terms. Here we report that auxin deprivation can be used to induce a uniform population of suspension-cultured tobacco (Nicotiana tabacum cv BY-2) cells to differentiate synchronously during a 4-d period. Upon removal of auxin, the cells stop dividing, undergo elongation, and differentiate in a manner that mimics the formation of slime-secreting epidermal and peripheral root-cap cells. The morphological changes to the Golgi apparatus include a proportional increase in the number of trans-Golgi cisternae, a switch to larger-sized secretory vesicles that bud from the trans-Golgi cisternae, and an increase in osmium staining of the secretory products. Biochemical alterations include an increase in large, fucosylated, mucin-type glycoproteins, changes in the types of secreted arabinogalactan proteins, and an increase in the amounts and types of molecules containing the peripheral root-cap-cell-specific epitope JIM 13. Taken together, these findings support the hypothesis that auxin deprivation can be used to induce tobacco BY-2 cells to differentiate synchronously into mucilage-secreting cells.


Figures

Figure 1
Figure 1
Inhibition of cell division is induced by auxin-deprived growth conditions. The average mitotic index of control cells (□) increased from 1.5 to about 6% after 1 d. The average mitotic index of auxin-deprived cells (•) decreased from 1.5 to 0% after 12 h. se is indicated for each data point by error bars.
Figure 2
Figure 2
Light micrographs of BY-2 tobacco cells 3 d after subculture with (a) and without (b) auxin. Control cells were found both in long chains (small arrow) and in clusters (large arrow). Auxin-deprived cells were elongated and did not form chains. Bars = 0.2 μm.
Figure 3
Figure 3
Scatterplot showing length and width of both control (top) and auxin-deprived (bottom) cells. Although auxin deprivation caused an increase in both average cell length and width, the most striking change was in cell length. The variance of the values also increased with auxin deprivation.
Figure 4
Figure 4
Auxin-deprived growth conditions induced elongation of BY-2 cells. The median cell length of the control cells (□) varied between 40 and 60 μm and decreased after 1 d. This decrease corresponded to the increase in mitotic index (Fig. 1). The median cell length of the auxin-deprived cells (•) increased to 110 μm after 3 d and then tapered off. se is indicated for each data point by error bars.
Figure 5
Figure 5
Electron micrographs of Golgi stacks from control (a) and auxin-deprived (b) BY-2 cells. In the control cells the Golgi stacks had a uniform distribution throughout the cytoplasm. In the auxin-deprived cells the Golgi stacks clustered together near the nucleus. G, Golgi stacks; M, mitochondria; N, nucleus; and V, vacuole. Bars = 0.5 μm.
Figure 6
Figure 6
Electron micrograph of a Golgi stack from a control BY-2 cell. The cis, medial, and trans cisternae are labeled. Intercisternal elements are indicated with arrows. Bar = 0.2 μm.
Figure 7
Figure 7
Electron micrographs of Golgi stacks from auxin-deprived BY-2 cells. Cells were fixed at 14 h (a), 1.5 d (b), and 4 d (c) after auxin deprivation. The cis, medial, and trans cisternae are labeled in b and c. Intercisternal filaments are indicated by arrowheads. After 14 h one could already see hypertrophied cisternal margins and a clustering of the stacks. After 1.5 d an increase in the size of the cisternal margins and an increase in the staining of intercisternal elements could be seen. After 3 to 4 d densely staining material appeared in the medial cisternae, and misshapen or thickened regions appeared in the interior of the Golgi stack. Bars = 0.2 μm.
Figure 8
Figure 8
Histogram illustrating the auxin-deprivation-induced increase in the number and proportion of trans-type cisternae (gray bars) in relation to the total number of cisternae (stippled bars). The total number of cisternae did not significantly change over time, but the average number of trans-type cisternae increased after 1.5 and 4 d of auxin deprivation.
Figure 9
Figure 9
SDS-PAGE (a) and western blots (b–d) of secreted material from control (+) and auxin-deprived (−) BY-2 cells. Molecular mass in kilodaltons is indicated to the left of the gels. All lanes were loaded with equal amounts of proteins. Western blots were probed with the lectins concanavalin A (Con A) and UEA-1 and with the monoclonal antibody JIM 13. b, Concanavalin A, a Man-specific lectin, showed minor changes in a set of N-linked glycoproteins between 45 and 97.5 kD. c, UEA-1, a Fuc-specific lectin, showed a major increase in a single, diffuse band between 100 and 200 kD. d, JIM 13, a marker of root-cap differentiation, showed an increase in staining between 40 and 180 kD. All gel images were digitized.
Figure 10
Figure 10
Quantitative differences in AGPs from control (+) and auxin-deprived (−) cells. Rocket-gel electrophoresis with β-glucosyl Yariv's artificial antigen was used to quantitatively compare control and auxin-deprived secreted material from BY-2 cells. The auxin-deprived cells secreted twice as much AGP as did the control, as shown by the height of the rockets.
Figure 11
Figure 11
Qualitative differences in AGPs from control (top) and auxin-deprived (bottom) cells. Crossed-gel electrophoresis with β-glucosyl Yariv's artificial antigen was used to qualitatively compare control and auxin-deprived secreted material from BY-2 cells. The wells in which the samples were loaded are indicated. The samples were first run in the horizontal direction and then in the vertical direction. The AGPs from the control cells formed two distinct peaks, whereas those from the auxin-deprived cells formed only one peak. The peak from the auxin-deprived cells traveled farther in the first dimension than did the major peak from the control cells.
Figure 12
Figure 12
Immunofluorescence micrograph of a tobacco root tip stained with the monoclonal antibody JIM 13. Staining was specifically localized to the peripheral root-cap cells. M, Meristem; C, columella; and P, peripheral root-cap cells. Bar = 50 μm.
Figure 13
Figure 13
Immunogold labeling of BY-2-cell Golgi stacks with JIM 13. Immunoelectron micrographs of control (a) and auxin-deprived (b) BY-2 cells showed an increase in the number of gold particles over the Golgi stacks and surrounding cytoplasm in the auxin-deprived cells. c, Histogram illustrating that gold-particle labeling over the Golgi stacks (gray bars) increased from an average of 1.4 particles in control cells, to 3.7 particles in 1.5-d auxin-deprived cells, to 6.0 particles in 4-d auxin-deprived cells. Gold-particle labeling over the surrounding cytoplasm (stippled bars) increased from 0.22 particle in control cells, to 0.40 particle in 1.5-d auxin-deprived cells, to 0.54 particle in 4-d auxin-deprived cells. Bars = 0.2 μm.
Figure 14
Figure 14
Model of the morphological changes in the Golgi apparatus during auxin deprivation. Schematic diagrams of control and auxin-deprived Golgi are shown with the cis, medial, and trans cisternae, and the TGN. Auxin deprivation induces a doubling in diameter of the budding vesicles around the cisternal margins (A), an increase in densely staining vesicles beyond the trans cisternae (B), an increase in the width and staining of intercisternal filaments (C), an increase in the number and proportion of trans cisternae (D), an increase in the staining of the medial and trans cisternae (E), and a decrease in staining of the cis cisternae.

Similar articles

Cited by

References

    1. Blum EA, Beier H, Gross HJ. Improved silver staining of plant proteins, RNA, and DNA in polyacrylamide gels. Electrophoresis. 1987;8:93–99.
    1. Craig S, Staehelin LA. High pressure freezing of intact plant tissues: evaluation and characterization of novel features of the endoplasmic reticulum and associated membrane systems. Eur J Cell Biol. 1988;46:80–93. - PubMed
    1. Cunninghame ME, Hall JL. A quantitative stereological analysis of the effect of indoleacetic acid on the dictyosomes in pea stem epidermal cells. Protoplasma. 1985;125:230–234.
    1. Driouich A, Levy S, Staehelin LA, Faye L. Structural and functional organization of the Golgi apparatus in plant cells. Plant Physiol Biochem. 1994;32:731–749.
    1. Driouich A, Zhang GF, Staehelin LA. Effect of brefeldin A on the structure of the Golgi apparatus and on the synthesis and secretion of proteins and polysaccharides in sycamore maple (Acer pseudoplatanus) suspension-cultured cells. Plant Physiol. 1993;101:1363–1373. - PMC - PubMed

Publication types

LinkOut - more resources