. 1998 Jun 15;187(12):1941-51.
doi: 10.1084/jem.187.12.1941.

Lung epithelial cells are a major site of murine gammaherpesvirus persistence

Affiliations

Lung epithelial cells are a major site of murine gammaherpesvirus persistence

J P Stewart et al. J Exp Med. .

Abstract

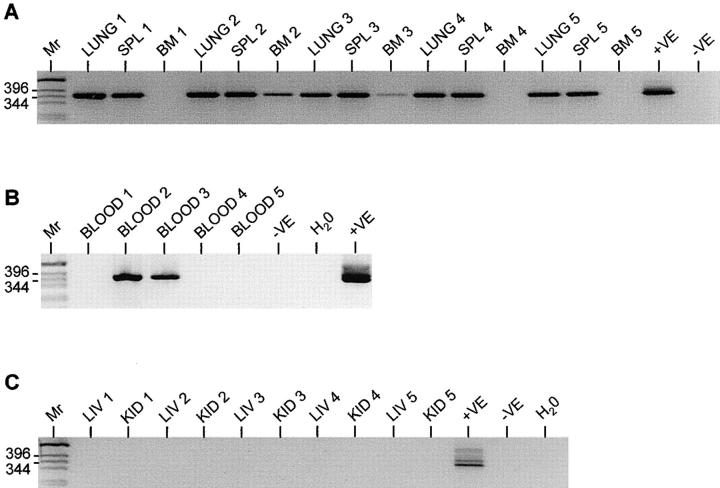
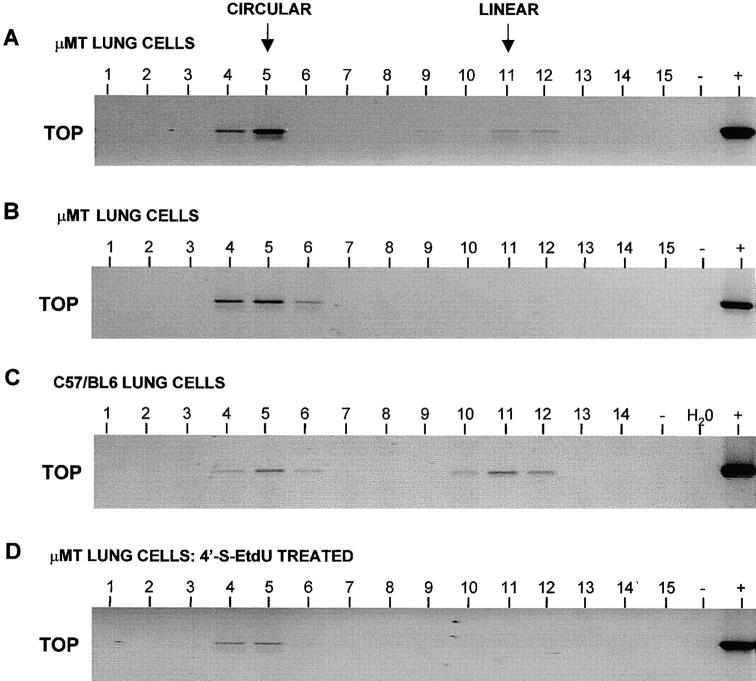
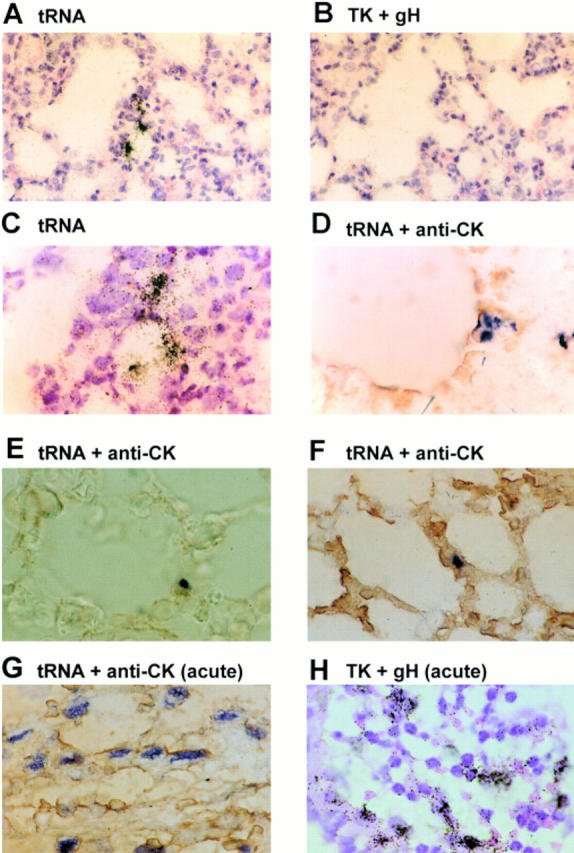
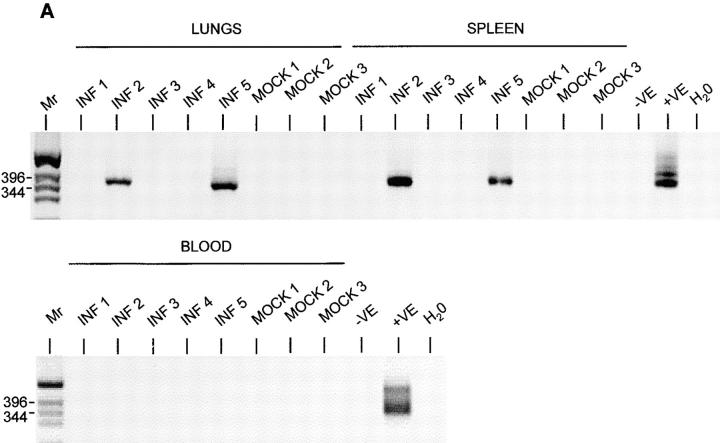
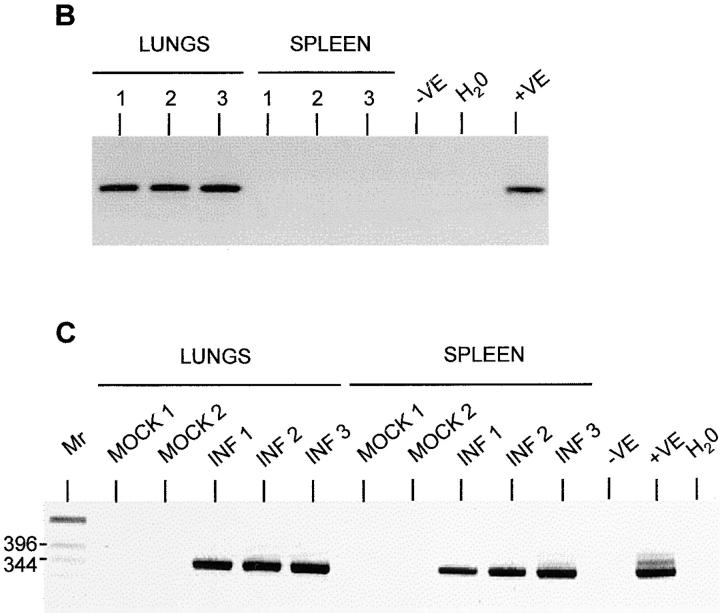
It is currently believed that latently infected, resting B lymphocytes are central to gammaherpesvirus persistence, whereas mucosal epithelial cells are considered nonessential. We have readdressed the question of nonlymphoid persistence using murine gammaherpesvirus 68 (MHV-68). To dissect lymphoid from nonlymphoid persistence, we used microMT transgenic mice that are defective in B cells. MHV-68 DNA persisted in the lungs of intact and B cell-deficient mice. Both episomal and linear forms of the virus genome were present in lungs, implying the presence of both latency and productive replication. In situ hybridization for virus tRNA transcripts revealed latent MHV-68 in pulmonary epithelial cells. Infectious virus was recovered from the lungs of microMT mice after T cell depletion, showing that the persisting virus DNA was reactivatable. Finally, using adoptive transfer of B cells into B cell-deficient mice, it was shown that virus persisting in lungs seeded splenic B cells, and virus resident in the spleen seeded the lungs. These results show that mucosal epithelia can act as a nonlymphoid reservoir for gammaherpesvirus persistence, and that there is a two-way movement of virus between lymphoid and nonlymphoid compartments during persistence.


Figures

Figure 1
Figure 1
Detection of MHV-68 in C57/BL6 mice by PCR. DNA was extracted from organs of five C57/BL6 mice which had been infected intranasally with MHV-68 for 12 mo and analyzed for the presence of MHV-68 DNA by nested PCR specific for the gp150 gene. Products were analyzed on 2% agarose gels containing ethidium bromide and visualized using a UV transilluminator. Images are shown with the colors reversed for clarity. Molecular weight determinations were made relative to a 1-kb DNA ladder (Mr), and the size of the pertinent bands in bp are shown at the left. In all panels, DNA from the MHV-68–positive tumor cell line S11 was used as a positive control (+VE), and produced the expected product of 368 bp. DNA from the MHV-68–negative tumor cell line S31 (−VE) was used along with deionized water (H2O) as a negative control. (A) The results of analysis of lungs (LUNG 1–5), spleens (SPL 1–5), and bone marrows (BM 1–5) of all five mice. (B) Analysis of blood (BLOOD 1–5) of all five mice. (C) Analysis of livers (LIV 1–5) and kidneys (KID 1–5) of all five mice.
Figure 2
Figure 2
Determination of MHV-68 DNA load in organs by QC-PCR. The precise number of copies of MHV-68 DNA present in the lung, spleen, and bone marrow (BM) in the same samples as in Fig. 1 was determined by QC-PCR. The results are presented on a scatter chart as the number of copies per 100 ng high molecular weight DNA for each organ in each mouse. Mouse 1 (♦); mouse 2 (▪); mouse 3 (▴); mouse 4 (X); and mouse 5 (•).
Figure 3
Figure 3
Analysis of MHV-68 DNA conformation in control cells by Gardella gel analysis. DNA in intact cells was fractionated using a Gardella (in situ–lysis) gel. A and B show Southern blot analysis of a Gardella gel. The gel is shown sideways for comparison with C and D, and the top of the gel is indicated (TOP). A shows the results of using the MHV-68–positive B cell line S11, which is known to contain both episomal and linear DNA. B shows the results of using C127 (murine epithelial cells), which had been acutely infected 24 h previously with 10 PFU/cell MHV-68. C and D show the results of slicing the Gardella gel and analyzing each slice for the presence of MHV-68 DNA by PCR. Therefore, each panel represents one lane of a Gardella gel, and the top is shown next to the first of the sequential slices. PCR products were analyzed on 2% agarose gels containing ethidium bromide and visualized using a UV transilluminator. Images are shown with the colors reversed for clarity. DNA from the MHV-68–positive tumor cell line S11 was used as a positive control (+), and produced the expected product of 368 bp. DNA from the MHV-68–negative tumor cell line S31 (−) was used as a negative control. C shows the results of using S11 cells as for A, and D shows the results of using S11 cells after treatment with the virus DNA replication inhibitor 4′-S-EtdU for 14 d. The positions of circular and linear MHV-68 DNA are shown (top).
Figure 4
Figure 4
Analysis of MHV-68 DNA conformation in lung cells by Gardella gel–PCR analysis. Intact cells were loaded into the wells of a Gardella (in situ–lysis) gel. After electrophoresis, individual lanes were cut sequentially into slices. Slices from each lane were then analyzed by PCR for the presence of MHV-68 DNA. PCR products were analyzed on 2% agarose gels containing ethidium bromide and visualized using a UV transilluminator. Images are shown with the colors reversed for clarity. Therefore, each panel represents one lane of a Gardella gel, and the top is shown next to the first of the sequential slices. The slices representing the positions on the Gardella gel of the circular and the linear forms of the genome are shown (top). In all panels, DNA from the MHV-68–positive tumor cell line S11 was used as a positive control (+), and produced the expected product of 368 bp. DNA from the MHV-68–negative tumor cell line S31 (−) was used along with deionized water (H2O) as a negative control. A, B, and D show results using cells from μMT mouse lungs 2 mo p.i., whereas C shows results using cells from C57/BL6 mice lungs 7 mo p.i. and are labeled accordingly. D shows the results using μMT mouse lungs at 2 mo p.i., but after treatment for the last 28 d of infection with the inhibitor of virus DNA replication 4′-S-EtdU.
Figure 5
Figure 5
Determination of cell type harboring latent MHV-68 in the lungs by in situ hybridization. Sections of 5 μM thickness were cut from formalin-fixed paraffin-embedded lung tissues from mice during virus persistence at 54 d p.i. (A–F). Control sections were derived from mice at 5 d p.i. (G and H, acute). Sections shown in A–C and H were hybridized with 35S-labeled riboprobes and developed using photographic emulsion. The sections shown in D–G were hybridized with digoxigenin-labeled riboprobes and developed using a combination of alkaline phosphatase–labeled antidigoxigenin followed by NBT/BCIP (blue/black). Probes used were specific for either the latency-associated tRNAs (A and C–G, tRNA) or the productive cycle–associated thymidine kinase (TK) and gH genes (B and H, TK + gH). D–G were additionally reacted with anticytokeratin antibody and developed using DAB (brown, anti-CK). A and B are adjacent serial sections from one μMT mouse biopsy. All other panels are derived from different μMT mice. A–C and H were counterstained with hematoxylin and eosin. A and B, ×230; C–H, ×580.
Figure 6
Figure 6
Detection of MHV-68 in organs of μMT mice after adoptive transfer of B lymphocytes. MHV-68 genomes were detected by nested PCR for gp150. Products were analyzed on 2% agarose gels containing ethidium bromide and visualized using a UV transilluminator. Images are shown with the colors reversed for clarity. Molecular weight determinations were made relative to a 1-kb DNA ladder (Mr), and the size of the pertinent bands in bp are shown at the left. In all panels, DNA from the MHV-68–positive tumor cell line S11 was used as a positive control (+VE), and produced the expected product of 368 bp. DNA from the MHV-68–negative tumor cell line S31 (−VE) was used along with deionized water (H2O) as a negative control. (A) T-depleted splenocytes from infected (INF 1–4) or mock-infected (MOCK 1–3) C57/BL6 mice were adoptively transferred into uninfected μMT mice. After 11 d, DNA was extracted and analyzed for MHV-68 by nested PCR. Results from analysis of the spleens, lungs, and blood are indicated above the relevant tracks. (B) Three persistently infected μMT mice (1–3) were analyzed for MHV-68 by nested PCR. Results from either lungs or spleen are shown above the relevant tracks. (C) T cell–depleted splenocytes from uninfected C57/BL6 mice were adoptively transferred into either mock-infected (MOCK 1 and 2) or persistently infected (INF 1–3) μMT mice. After 14 d, DNA was extracted and analyzed for MHV-68 by nested PCR. Results from analysis of the spleens and lungs are indicated above the relevant tracks.
Figure 6
Figure 6
Detection of MHV-68 in organs of μMT mice after adoptive transfer of B lymphocytes. MHV-68 genomes were detected by nested PCR for gp150. Products were analyzed on 2% agarose gels containing ethidium bromide and visualized using a UV transilluminator. Images are shown with the colors reversed for clarity. Molecular weight determinations were made relative to a 1-kb DNA ladder (Mr), and the size of the pertinent bands in bp are shown at the left. In all panels, DNA from the MHV-68–positive tumor cell line S11 was used as a positive control (+VE), and produced the expected product of 368 bp. DNA from the MHV-68–negative tumor cell line S31 (−VE) was used along with deionized water (H2O) as a negative control. (A) T-depleted splenocytes from infected (INF 1–4) or mock-infected (MOCK 1–3) C57/BL6 mice were adoptively transferred into uninfected μMT mice. After 11 d, DNA was extracted and analyzed for MHV-68 by nested PCR. Results from analysis of the spleens, lungs, and blood are indicated above the relevant tracks. (B) Three persistently infected μMT mice (1–3) were analyzed for MHV-68 by nested PCR. Results from either lungs or spleen are shown above the relevant tracks. (C) T cell–depleted splenocytes from uninfected C57/BL6 mice were adoptively transferred into either mock-infected (MOCK 1 and 2) or persistently infected (INF 1–3) μMT mice. After 14 d, DNA was extracted and analyzed for MHV-68 by nested PCR. Results from analysis of the spleens and lungs are indicated above the relevant tracks.

References

    1. Rickinson, A.B., and E. Kieff. 1996. Epstein-Barr virus. In Fields Virology. B.N. Fields, D.M. Knipe, and P.M. Howley, editors. Lippincott-Raven Publishers, New York. 2397– 2446.
    1. Chang Y, Cesarman E, Pessin MS, Lee F, Culpepper J, Knowles DM, Moore PS. Identification of herpesvirus-like DNA sequences in AIDS-associated Kaposi's sarcoma. Science. 1994;266:1865–1869. - PubMed
    1. Roizmann B, Desrosiers RC, Fleckenstein B, Lopez C, Minson AC, Studdert MJ. The family Herpesviridae: an update. The Herpesvirus Study Group of the International Committee on Taxonomy of Viruses. Arch Virol. 1992;123:425–449. - PubMed
    1. Greenspan JS, Greenspan D, Lennette ET, Abrams DI, Conant MA, Peterson V, Freese UK. Replication of Epstein-Barr virus within the epithelial cell of oral “hairy” leukoplakia, an AIDS-associated lesion. N Engl J Med. 1985;313:1564–1571. - PubMed
    1. Sixbey JW, Nedrud JG, Raab-Traub N, Hanes RA, Pagano JS. Epstein-Barr virus replication in oropharyngeal epithelial cells. N Engl J Med. 1984;310:1225–1230. - PubMed

Publication types