. 1998 Jul 1;510 ( Pt 1)(Pt 1):93-102.
doi: 10.1111/j.1469-7793.1998.093bz.x.

K+ channel block-induced mammalian neuroblastoma cell swelling: a possible mechanism to influence proliferation

Affiliations

K+ channel block-induced mammalian neuroblastoma cell swelling: a possible mechanism to influence proliferation

B Rouzaire-Dubois et al. J Physiol. .

Abstract

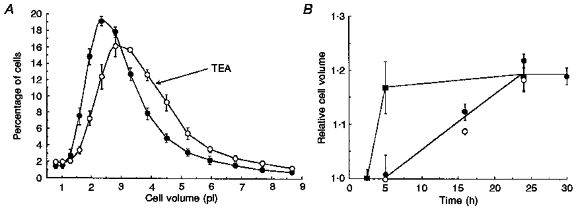
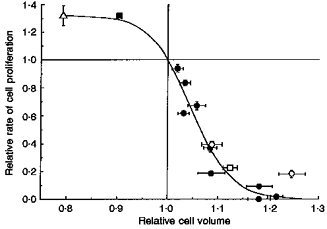
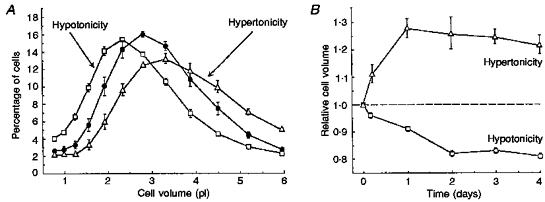
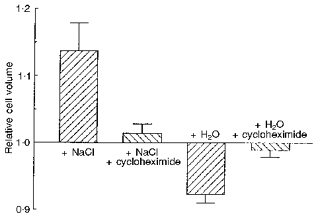
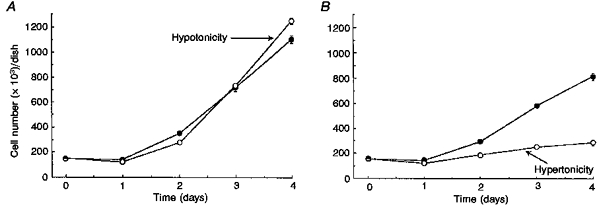
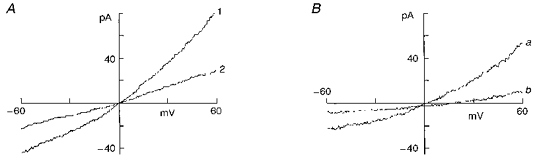
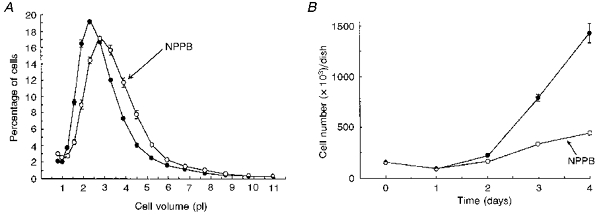
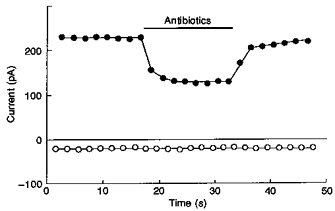
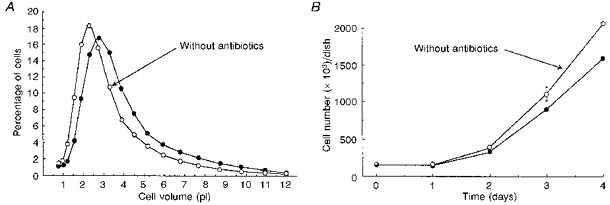
1. A variety of studies have suggested that K+ channel activity is a key determinant for cell progression through the G1 phase of mitosis. We have previously proposed that K+ channels control the activity of cell cycle-regulating proteins via regulation of cell volume. In order to test this hypothesis, we measured, with a Coulter counter and under different experimental conditions, the volume and rate of proliferation of neuroblastoma x glioma hybrid NG108-15 cells. 2. The K+ channel blockers TEA (1-10 mM), 4-aminopyridine (0.2-2 mM) and Cs+ (2.5-10 mM) increased the cell volume and decreased the rate of cell proliferation. Proliferation was fully inhibited when cell volume was increased by 25 %. 3. A 40 % increase in the culture medium osmolarity with NaCl induced a 25 % increase in cell volume and an 82 % decrease in the rate of cell proliferation. A 40 % increase in the culture medium osmolarity with mannitol induced a 9 % increase in cell volume and a 60 % decrease in the rate of cell proliferation. 4. The Cl- channel blocker NPPB (5-nitro-2-(3-phenylpropylamino) benzoic acid; 50 microM) induced a 12 % increase in cell volume and a 77 % decrease in the rate of cell proliferation. 5. A 24 % reduction in the culture medium osmolarity with H2O induced a 21 % decrease in cell volume and a 32 % increase in the rate of cell proliferation. 6. Under whole-cell patch-clamp conditions, antibiotics (penicillin plus streptomycin) decreased the voltage-dependent K+ current. Omission of antibiotics from the culture medium induced a 10 % decrease in the cell volume and a 32 % increase in the rate of cell proliferation. 7. These results suggest that the mechanisms controlling cell proliferation are strongly influenced by the factors which determine cell volume. This could take into account the role in mitogenesis of K+ channels and of other ionic pathways involved in cell volume regulation.


Figures

Figure 1
Figure 1. K+ channel blockers induce cell swelling
A, volume distributions of cells cultured for 24 h with (○) and without (•) 10 mM TEA. Means ± s.e.m. of 3 experiments. B, time course of cell swelling induced by 10 mM TEA (•), 10 mM Cs+ (○) and 2 mM 4-AP (▪). Means ± s.e.m. of 3-5 experiments.
Figure 9
Figure 9. Cell proliferation-volume relationship
The relative rate of cell proliferation and the relative mean cell volume were determined in the presence of TEA (1, 5 and 10 mM), 4-AP (0.2 and 2 mM), Cs+ (2.5, 5 and 10 mM) (•), 50 μM NPPB (□), in hypertonic medium (○), in hypotonic medium (▵) and without antibiotics (▪). In each case, cell volume and proliferation are expressed relative to control conditions where cells were cultured simultaneously in control culture medium. Means ± s.e.m. of 3-6 experiments in each condition. The curve was drawn from eqn (4) with Pmax = 1.32, V0.5 = 1.045 and k = 0.039.
Figure 2
Figure 2. Long-term effects of anisotonicity on cell volume
The cells were cultured in isotonic, hypotonic (24 % decrease in osmolarity by the addition of H2O) or hypertonic (40 % increase in osmolarity by the addition of NaCl) culture medium. Means ± s.e.m. of 3-5 experiments. A, volume distribution of cells incubated for 48 h in isotonic (•), hypotonic (□) or hypertonic (▵) medium. B, time courses of cell volume changes in hypertonic and hypotonic media. Note that cell volume changes were opposite to those expected from purely osmotic effects.
Figure 3
Figure 3. Effect of cycloheximide on anisotonicity induced long-term cell volume changes
Relative volume of cells after 5 h incubation in hypertonic medium (40 % increase in osmolarity by the addition of NaCl) or 7.5 h incubation in hypotonic medium (24 % decrease in osmolarity by the addition of H2O) with or without 20 μM cycloheximide. Means + s.e.m. of 3 experiments. Volumes in anisotonic media with and without cycloheximide are expressed relative to volumes in isotonic media with and without cycloheximide, respectively.
Figure 4
Figure 4. Effect of anisotonic media on cell proliferation
A, cells were cultured in control (•) or in hypotonic (○; 24 % decrease in tonicity by the addition of 30 % H2O) media. In isotonic and hypotonic media, the fetal calf serum concentration was 5 %. Means ± s.e.m. of 4 experiments. The numbers of cells at days 2 and 4 were significantly different in control and in hypotonic media (P < 0.05, Student's unpaired t test). B, cells were cultured in isotonic (•) or hypertonic (○; 40 % increase in tonicity by the addition of 65 mM NaCl) media. Means ± s.e.m. of 3 experiments
Figure 5
Figure 5. NPPB blocks a Cl current in isotonic conditions
Currents were recorded during ramp potentials (100 mV s−1) applied from −60 to +60 mV. The pipette solution contained 140 mM CsCl to block K+ currents. NPPB was dissolved in DMSO which was added at the same concentration (0.25 %) to the control solution. A, current-voltage curves obtained in control (1) and after addition of 50 μM NPPB to the external solution (2). B, NPPB-sensitive current as a function of voltage with 140 mM NaCl (a) or 70 mM NaCl + 140 mM sucrose (b) in the external solution. Traces a and b were recorded from 2 different cells. In both cases, the liquid junction potential was corrected before seal formation.
Figure 6
Figure 6. Effects of NPPB on cell volume and proliferation
A, volume distributions of cells cultured with (○) or without (•) 50 μM NPPB. Means ± s.e.m. of 4 experiments. B, cell proliferation curves with (○) and without (•) 50 μM NPPB. Means ± s.e.m. of 4 experiments. In A and B, 0.25 % DMSO was added to the control medium.
Figure 7
Figure 7. Effects of antibiotics on membrane currents
The membrane current was recorded alternately at -85 and 0 mV (450 ms depolarizations to 0 mV applied at a frequency of 0.5 Hz from a holding potential of −85 mV). The antibiotics (1000 i.u. ml−1 penicillin and 1 mg ml−1 streptomycin) decreased the current at 0 mV (•) but had no effect on the current at −85 mV (○).
Figure 8
Figure 8. Effects of antibiotics on cell volume and proliferation
A, volume distributions of cells cultured with (•) or without (○) antibiotics. Means ± s.e.m. of 3 experiments. B, cell proliferation curves with (•) and without (○) antibiotics. Means ± s.e.m. of 3 experiments.

Similar articles

Cited by

References

    1. Artalejo AR, Garcia-Sancho J. Mobilization of intracellular calcium by extracellular ATP and by calcium ionophores in the Ehrlich ascites-tumour cell. Biochimica et Biophysica Acta. 1988;941:48–54. - PubMed
    1. Berl T, Siriwardana G, Ao L, Butterfield LM, Heasley LE. Multiple mitogen-activated protein kinases are regulated by hyperosmolality in mouse IMCD cells. American Journal of Physiology. 1997;272:F305–311. - PubMed
    1. Burg MB, Kwon ED, Kültz D. Osmotic regulation of gene expression. FASEB Journal. 1996;10:1598–1606. - PubMed
    1. Chiu SY, Wilson GF. The role of potassium channels in Schwann cell proliferation in Wallerian degeneration of explant rabbit sciatic nerves. The Journal of Physiology. 1989;408:199–222. - PMC - PubMed
    1. Clay JR, Shlesinger MF. Effects of external cesium and rubidium on outward potassium currents in squid axons. Biophysical Journal. 1983;42:43–53. - PMC - PubMed

MeSH terms

LinkOut - more resources