. 1998 Jul 1;510 ( Pt 1)(Pt 1):135-43.
doi: 10.1111/j.1469-7793.1998.135bz.x.

Control of pulsatile 5-HT/insulin secretion from single mouse pancreatic islets by intracellular calcium dynamics

Affiliations

Control of pulsatile 5-HT/insulin secretion from single mouse pancreatic islets by intracellular calcium dynamics

R M Barbosa et al. J Physiol. .

Abstract

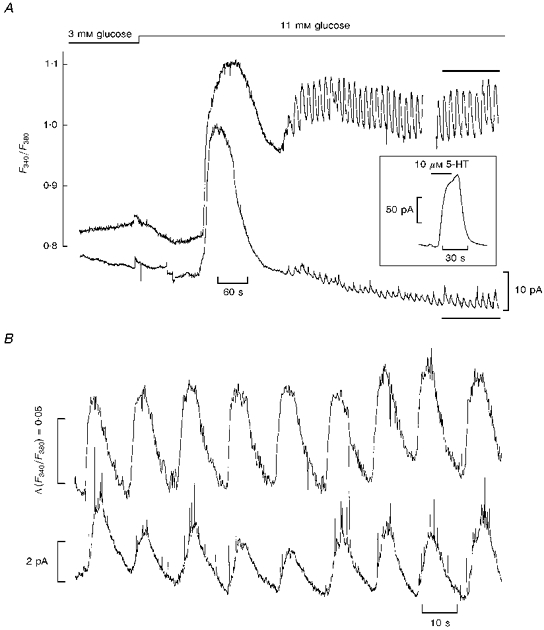
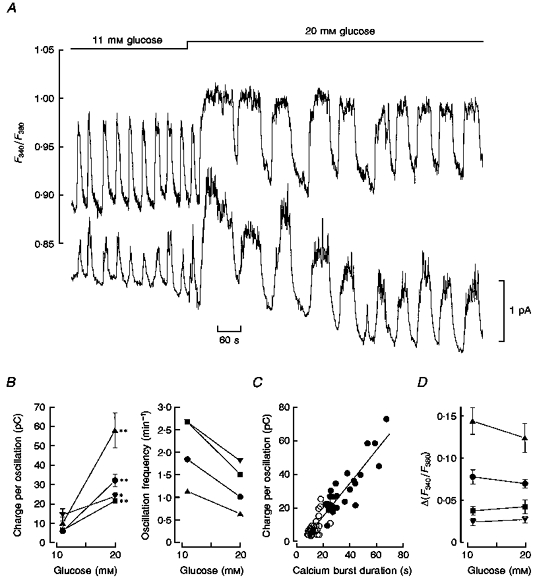
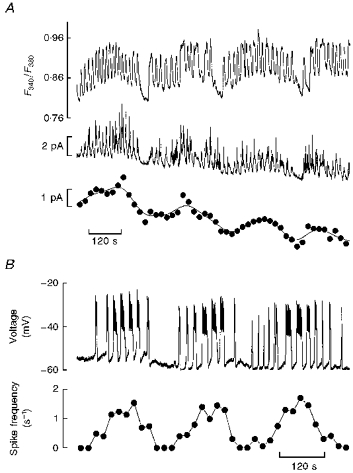
1. Glucose-induced insulin release from single islets of Langerhans is pulsatile. We have investigated the correlation between changes in cytosolic free calcium concentration ([Ca2+]i) and oscillatory insulin secretion from single mouse islets, in particular examining the basis for differences in secretory responses to intermediate and high glucose concentrations. Insulin release was monitored in real time through the amperometric detection of the surrogate insulin marker 5-hydroxytryptamine (5-HT) via carbon fibre microelectrodes. The [Ca2+]i was simultaneously recorded by whole-islet fura-2 microfluorometry. 2. In 82 % of the experiments, exposure to 11 mM glucose evoked regular high-frequency (average, 3.4 min-1) synchronous oscillations in amperometric current and [Ca2+]i. In the remaining experiments (18 %), 11 mM glucose induced an oscillatory pattern consisting of high-frequency [Ca2+]i oscillations that were superimposed on low-frequency (average, 0.32 min-1) [Ca2+]i waves. Intermittent high-frequency [Ca2+]i oscillations gave rise to a similar pattern of pulsatile 5-HT release. 3. Raising the glucose concentration from 11 to 20 mM increased the duration of the steady-state [Ca2+]i oscillations without increasing their amplitude. In contrast, both the duration and amplitude of the associated 5-HT transients were increased by glucose stimulation. The amount of 5-HT released per secretion cycle was linearly related to the duration of the underlying [Ca2+]i oscillations in both 11 and 20 mM glucose. The slopes of the straight lines were identical, indicating that there is no significant difference between the ability of calcium oscillations to elicit 5-HT/insulin release in 11 and 20 mM glucose. 4. In situ 5-HT microamperometry has the potential to resolve the high-frequency oscillatory component of the second phase of glucose-induced insulin secretion. This component appears to reflect primarily the duration of the underlying [Ca2+]i oscillations, suggesting that glucose metabolism and/or access to glucose metabolites is not rate limiting to fast pulsatile insulin release.


Figures

Figure 1
Figure 1. Simultaneous recording of [Ca2+]i and 5-HT/insulin release from single pancreatic islets
A, upper trace: microfluorometric recording of [Ca2+]i from a single fura-2/5-HT-loaded islet, as given by the ratio of fura-2 fluorescence at 340 and 380 nm (F340/F380). The gap represents a period where the [Ca2+]i was not recorded. Lower trace: continuous recording of amperometric current from the same islet through a carbon fibre microelectrode. Glucose concentration was stepped from 3 to 11 mM as indicated. Inset: effect of applying a step pulse (bar) of a 5-HT-containing solution on the amperometric current recorded in situ. B, expanded representation of steady-state [Ca2+]i and amperometric current in 11 mM glucose (from the experiment depicted in A, portion depicted by bars).
Figure 2
Figure 2. Modulation of intracellular calcium burst dynamics and pulsatile 5-HT/insulin release by glucose
A, upper trace: continuous recording of [Ca2+]i (F340/F380 fluorescence ratio) from a single fura-2/5-HT-loaded islet; lower trace: continuous recording of 5-HT/insulin release (amperometric current) from the same islet. Glucose concentration was stepped from 11 to 20 mM (bar). B, analysis of the glucose dependence of pulsatile 5-HT/insulin release, in terms of the time integral of the current response for each cycle (in pC, left) and oscillation frequency (right). Both parameters were assessed at the steady state of 11 and 20 mM glucose (data from four experiments including that depicted in A, represented by circles). Each point represents the mean value ± s.e.m. (n = 6 cycles). Statistical significance of differences was assessed by Student's t test (* P < 0.05; ** P < 0.001). C, correlation between the integrated current response per cycle and the duration (time from half-rise to half-decay) of the underlying [Ca2+]i oscillation. Both parameters were assessed at the steady state of 11 and 20 mM glucose. Pooled non-normalized data from four experiments (open and filled symbols for 11 and 20 mM glucose, respectively). The straight line was drawn by least squares fitting to the whole data (slope, 0.97 pC s−1; correlation coefficient, 0.93). D, maximal amplitude of the [Ca2+]i oscillations as a function of glucose concentration. Δ (F340 /F380) was assessed at the steady state of 11 and 20 mM glucose (data from the same experiments used to generate the data in B). Each point represents the mean value ± s.e.m., for n = 6 cycles (the differences within each experiment were not statistically significant by Student's t test, P > 0.05).
Figure 3
Figure 3. Low-frequency variation in global 5-HT/insulin release and electrical activity
A, simultaneous [Ca2+]i (uppermost trace) and amperometric current recording (middle trace) from an islet displaying periodic low-frequency oscillations (11 mM glucose throughout). The lowest trace is a re-plot of the continuous amperometric recording, using 20 s averaging periods. The line through the points was generated by fast Fourier transform smoothing of the original amperometric data. Note the appearance of a low-frequency pattern of global 5-HT/insulin release. B, trace: continuous intracellular recording of membrane potential from a microdissected islet depicting an intermittent bursting pattern of electrical activity (11 mM glucose throughout); plot: average spike frequency vs. time for the experiment depicted in the upper trace. Spike frequency was calculated at 20 s intervals. The plot reveals a secondary oscillation frequency of 0.25 min−1. Representative of five similar experiments.

Similar articles

Cited by

References

    1. Alvarezde Toledo G, Fernandez-Chacon R, Fernandez JM. Release of secretory products during transient vesicle fusion. Nature. 1993;363:554–558. 10.1038/363554a0. - DOI - PubMed
    1. Ämmälä C, Eliasson L, Bokvist K, Larsson O, Ashcroft FM, Rorsman P. Exocytosis elicited by action potentials and voltage-clamp calcium currents in individual mouse pancreatic β-cells. The Journal of Physiology. 1993;472:665–688. - PMC - PubMed
    1. Barbosa RM, Rosário LM, Brett CMA, Oliveira-Brett AM. Electrochemical studies of zinc in zinc-insulin solution. Analyst. 1996a;121:1789–1793. - PubMed
    1. Barbosa RM, Silva AM, Tomé AR, Stamford JA, Santos RM, Rosário LM. Real time electrochemical detection of 5-HT/insulin secretion from single pancreatic islets: effect of glucose and K+ depolarization. Biochemical and Biophysical Research Communications. 1996b;228:100–104. - PubMed
    1. Bergsten P. Slow and fast oscillations of cytoplasmic Ca2+ in pancreatic islets correspond to pulsatile insulin release. American Journal of Physiology. 1995;268:E282–287. - PubMed

Publication types

LinkOut - more resources