. 1998 Jul 1;510 ( Pt 1)(Pt 1):269-77.
doi: 10.1111/j.1469-7793.1998.269bz.x.

Mechanisms underlying reduced maximum shortening velocity during fatigue of intact, single fibres of mouse muscle

Affiliations

Mechanisms underlying reduced maximum shortening velocity during fatigue of intact, single fibres of mouse muscle

H Westerblad et al. J Physiol. .

Abstract

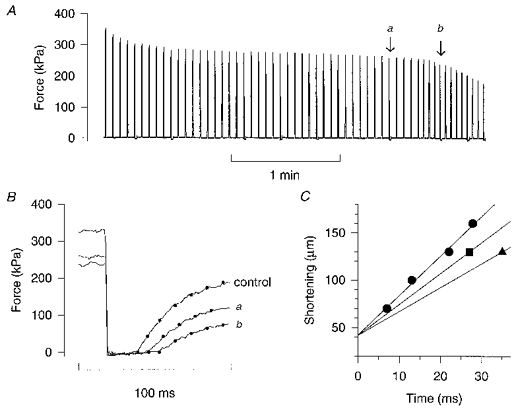
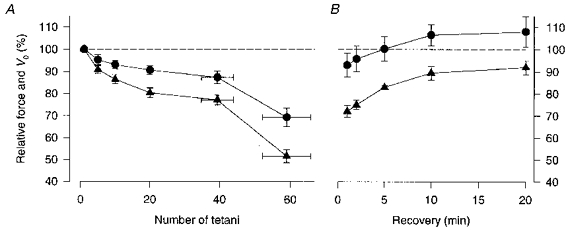
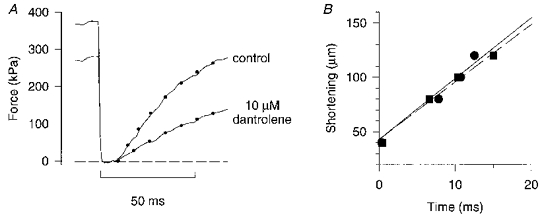
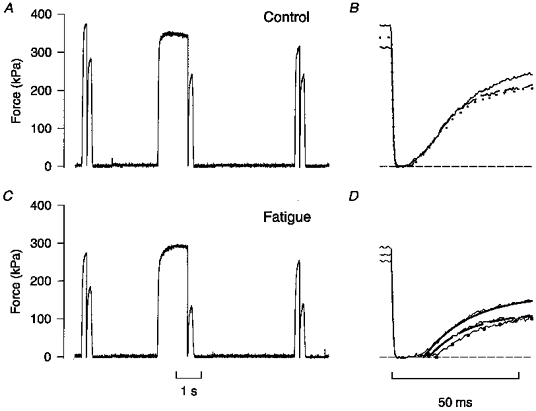
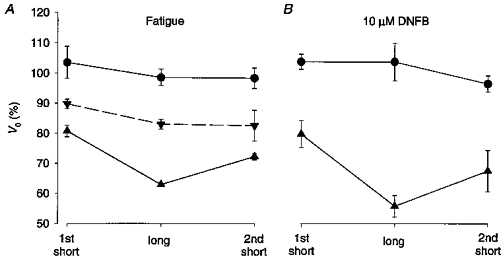
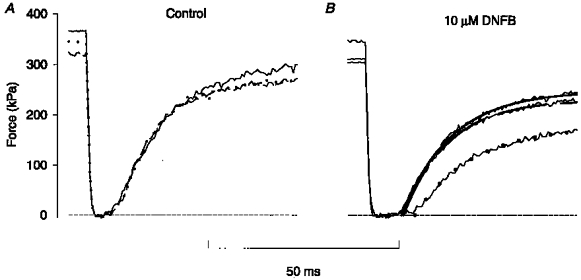
1. The mechanism behind the reduction in shortening velocity in skeletal muscle fatigue is unclear. In the present study we have measured the maximum shortening velocity (V0) with slack tests during fatigue produced by repeated, 350 ms tetani in intact, single muscle fibres from the mouse. We have focused on two possible mechanisms behind the reduction in V0: reduced tetanic Ca2+ and accumulation of ADP. 2. During fatigue V0 initially declined slowly, reaching 90 % of the control after about forty tetani. The rate of decline then increased and V0 fell to 70 % of the control in an additional twenty tetani. The reduction in isometric force followed a similar pattern. 3. Exposing unfatigued fibres to 10 microM dantrolene, which reduces tetanic Ca2+, lowered force by about 35 % but had no effect on V0. 4. In order to see if ADP might increase rapidly during ongoing contractions, we used a protocol with a tetanus of longer duration bracketed by standard-duration tetani. V0 in these three tetani were not significantly different in control, whereas V0 was markedly lower in the longer tetanus during fatigue and in unfatigued fibres where the creatine kinase reaction was inhibited by 10 microM dinitrofluorobenzene. 5. We conclude that the reduction in V0 during fatigue is mainly due to a transient accumulation of ADP, which develops during contractions in fibres with impaired phosphocreatine energy buffering.


Figures

Figure 1
Figure 1. The maximum shortening velocity (V0) declines rapidly towards the end of fatigue runs
A, continuous force record from a fatigue run of a single mouse muscle fibre. Each spike represents a 100 Hz, 350 ms tetanus. Small deflections below the zero force level indicate tetani where the shortening step was produced; the amplitude of the shortening step was 130 μm and L0 was 768 μm. B, force responses to the rapid shortening step performed before fatiguing stimulation (control) and during fatigue at the tetani marked in A, i.e. at the end of phase 2 (a) and during phase 3 (b). In order to get an objective measure of the starting point of force redevelopment, a single exponential function was fitted to the each force record (dots). C, a plot of the amplitude of shortening steps vs. the times to take up the slack. Releases of four amplitudes were produced in control (•) and linear regression was used to get the slope and the intercept on the shortening axis, which was considered to be constant when V0 during fatigue was estimated. ▪ and ▴ show measurements from tetanus a and b, respectively.
Figure 2
Figure 2. The decline in relative force and V0 follow a similar pattern during fatigue
Mean data (± s.e.m.) of relative force (▴) and V0 (•) during fatigue (A; n = 7) and recovery (B; n = 4). Force and V0 in control are set to 100 %; for clarity the 100 % level is indicated by the dashed lines. The position on the x-axis of the last two data points in A represents the mean number of tetani (± s.e.m.) required to reach the end of phase 2 and to reduce force to about 50 % of the control, respectively.
Figure 3
Figure 3. Dantrolene depresses force but has no effect on V0
A, force responses to a 100 μm release (L0 = 740 μm) in control and after 7 min in 10 μM dantrolene. Dots represent mono-exponential curve fits to the force redevelopment. Horizontal dashed line indicates zero force. B, a plot of the shortening amplitude against time to take up the slack in control (•) and during exposure to dantrolene (▪). V0, obtained with linear regression, was 7.64 L0 s−1 in control (continuous line) and 7.18 L0 s−1 with dantrolene (dashed line).
Figure 4
Figure 4. Increasing the tetanus duration delays force redevelopment during fatigue
Test series consisting of a 400, a 1400, and a second 400 ms tetanus produced under control conditions (A) and during fatigue at the end of phase 2 (C). B, superimposed records of force redevelopment in the three control tetani shown in A: continuous trace, first short tetanus; dotted trace, long tetanus; discontinuous trace, second short tetanus. D, records of force redevelopment from C. Superimposed continuous and dashed lines and dots show mono-exponential curve fits for, respectively, the first and second short tetani and the long tetanus, as in B. Horizontal dashed lines in B and D represent zero force.
Figure 5
Figure 5. V0 declines with increasing tetanus duration in fatigue and with inhibition of creatine kinase
Mean V0 data (±s.e.m.) recorded during a short tetanus followed by a long tetanus and then a second short tetanus. A, data from four experiments with fatiguing stimulation: •, control; ▴, end of phase 2; ▾, 1 min after the end of fatiguing stimulation. B, data from four experiments where the creatine kinase reaction was inhibited by 10 μM dinitrofluorobenzene (DNFB): •, control; ▾, after 10 min in DNFB. 100 % represents V0 obtained from releases of various amplitudes performed in each fibre under control conditions (see Methods).
Figure 6
Figure 6. Inhibition of the creatine kinase reaction delays force redevelopment in tetani with increased duration
A, force records from releases produced during a short tetanus, followed by a long tetanus and then a second short tetanus under control conditions. Continuous trace, first short (400 ms) tetanus; dotted trace, long (1400 ms) tetanus; discontinuous trace, second short tetanus. B, force records from releases produced in the same fibre as in A after 10 min exposure to 10 μM DNFB. Mono-exponential curves were fitted to the force redevelopment; meaning of lines as in A. Horizontal dashed lines indicate zero force.

Similar articles

Cited by

References

    1. Allen DG, Lännergren J, Westerblad H. Muscle cell function during prolonged activity: cellular mechanisms of fatigue. Experimental Physiology. 1995;80:497–527. - PubMed
    1. Barclay CJ. Mechanical efficiency and fatigue of fast and slow muscles of the mouse. The Journal of Physiology. 1996;497:781–794. - PMC - PubMed
    1. Brenner B. Effects of Ca2+ on cross-bridge turnover kinetics in skinned single rabbit psoas fibers: Implications for regulation of muscle contraction. Proceedings of the National Academy of Sciences of the USA. 1988;85:3265–3269. - PMC - PubMed
    1. Butler TM, Siegman MJ, Mooers SU, Barsotti RJ. Myosin light chain phosphorylation does not modulate cross-bridge cycling rate in mouse skeletal muscle. Science. 1983;220:1167–1169. - PubMed
    1. Chase PB, Kushmerick MJ. Effect of physiological ADP concentrations on contraction of single skinned fibers from rabbit fast and slow muscles. American Journal of Physiology. 1995;268:C480–489. - PubMed

Publication types

LinkOut - more resources