. 1998 Jun 15;141(6):1311-22.
doi: 10.1083/jcb.141.6.1311.

GalNAc-alpha-O-benzyl inhibits NeuAcalpha2-3 glycosylation and blocks the intracellular transport of apical glycoproteins and mucus in differentiated HT-29 cells

Affiliations

GalNAc-alpha-O-benzyl inhibits NeuAcalpha2-3 glycosylation and blocks the intracellular transport of apical glycoproteins and mucus in differentiated HT-29 cells

G Huet et al. J Cell Biol. .

Abstract

Exposure for 24 h of mucus-secreting HT-29 cells to the sugar analogue GalNAc-alpha-O-benzyl results in inhibition of Galbeta1-3GalNAc:alpha2,3-sialyltransferase, reduced mucin sialylation, and inhibition of their secretion (Huet, G., I. Kim, C. de Bolos, J.M. Loguidice, O. Moreau, B. Hémon, C. Richet, P. Delannoy, F.X. Real., and P. Degand. 1995. J. Cell Sci. 108:1275-1285). To determine the effects of prolonged inhibition of sialylation, differentiated HT-29 populations were grown under permanent exposure to GalNAc-alpha-O-benzyl. This results in not only inhibition of mucus secretion, but also in a dramatic swelling of the cells and the accumulation in intracytoplasmic vesicles of brush border-associated glycoproteins like dipeptidylpeptidase-IV, the mucin-like glycoprotein MUC1, and carcinoembryonic antigen which are no longer expressed at the apical membrane. The block occurs beyond the cis-Golgi as substantiated by endoglycosidase treatment and biosynthesis analysis. In contrast, the polarized expression of the basolateral glycoprotein GP 120 is not modified. Underlying these effects we found that (a) like in mucins, NeuAcalpha2-3Gal-R is expressed in the terminal position of the oligosaccharide species associated with the apical, but not the basolateral glycoproteins of the cells, and (b) treatment with GalNAc-alpha-O-benzyl results in an impairment of their sialylation. These effects are reversible upon removal of the drug. It is suggested that alpha2-3 sialylation is involved in apical targeting of brush border membrane glycoproteins and mucus secretion in HT-29 cells.


Figures
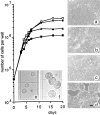
Figure 1
Figure 1
Dose-dependent effect of GalNAc-α-O-benzyl on cell growth, cell density, and cell volume. HT29-RevMTX10−6 mucus-secreting cells were cultured in 24-well cell culture clusters in the absence (□) or under permanent exposure to 0.5 (♦), 1 (▴), or 2 mM (▪) GalNAc-α-O-benzyl. Values of growth curves are the means of five different passages. SD (data not shown) are less than 5%. (a–d) Phase-contrast microscopy of the cell layer of (a) control cells and cells treated with (b) 0.5, (c) 1, and (d) 2 mM GalNAc-α-O-benzyl after 20 d in culture. Cells treated with 0.1 mM GalNAc-α-O-benzyl were similar to control cells (data not shown). (e and f) Light microscopy in a Malassez cell of cells trypsinized after 20 d in culture: (e) control cells; (f) cells treated with 2 mM GalNAc-α-O-benzyl. The volume of the cells corresponding to e and f, as deduced from hematocrit and cell number, is 1.5 ± 0.1 μm3 per 106 cells in control, versus 8.5 ± 0.3 μm3 per 106 cells in treated cells. Bar, 75 μm.
Figure 2
Figure 2
Effects of GalNAc-α-O-benzyl on cell morphology and mucus expression in HT29-RevMTX10−6 mucus-secreting cells. Cells were cultured in the absence or under permanent exposure to 2 mM GalNAc-α-O-benzyl and then analyzed after 21 d in culture. Left column, light microscopy of thin sections of the cell layer perpendicular to the surface of the flask. Middle column, alcian blue staining of cryostat sections of cell layers from the same cultures, counterstained with nuclear red. Right column, indirect immunofluorescence staining with pAb L56/C of cryostat sections of the same cell layers. (a–c) Untreated cells; (d–f), cells treated with GalNAc-α-O-benzyl. Bars: left column (17 μm); middle and right columns (40 μm).
Figure 4
Figure 4
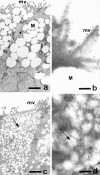
Ultrastructural morphology and localization of DPP-IV in control and GalNAc-α-O-benzyl–treated HT-29 mucus-secreting cells. HT29-RevMTX10−6 cells were analyzed after 21 d of culture in the absence (a and b) or presence (c and d) of 2 mM GalNAc-α-O-benzyl. (a and c) Standard transmission electron microscopy of sections perpendicular to the bottom of the flask showing the apical microvilli in both control and treated cells, the accumulation of mucus droplets (M) in the apical compartment of control cells, and the very numerous vesicles (arrow) in treated cells. (b and d) Immunogold labeling of DPP-IV using mAb HBB 3/775/42: in control cells the gold particles are strictly restricted to the microvilli and absent from the mucus droplets; in treated cells the gold particles are associated with the cytoplasmic vesicles. Similar results were obtained with MUC1 and CEA (data not shown). Bars: (a and c) 1.2 μm; (b) 0.16 μm; (c) 0.28 μm.
Figure 3
Figure 3
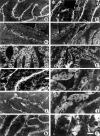
Effect of GalNAc-α-O-benzyl on the cellular distribution of polarized proteins in mucus-secreting HT-29 cells. Indirect immunofluorescence detection of polarized proteins in frozen cryostat sections of the cell layers from control (left column) and 2 mM GalNAc-α-O-benzyl– treated HT29-RevMTX10−6 cells (right column) analyzed after 21 d in culture. Sections of the cell layers were single labeled with antibodies against villin (a and b), ZO1 (c and d), glycoprotein GP120 (e and f), DPP-IV (g and h), MUC1 (i and j), and CEA (k and l). Bar, 40 μm.
Figure 5
Figure 5
Level of expression of DPP-IV in GalNAc-α-O-benzyl–treated mucus-secreting HT-29 cells. Control (c) and cells treated with 2 mM GalNAc-α-O-benzyl (t) were analyzed after 21 d in culture. (A) Northern blot analysis of DPP-IV, using villin as internal control. (B) Immunoblot analysis, with mAb 4H3 of DPP-IV in cell homogenates. (C) Analysis of DPP-IV enzymatic activity in the cell homogenates from control (open bar) and treated cells (solid bar); results are the means of three different cultures corresponding to three different passages. The apparent discrepancy between the relatively discrete (1.6-fold) increase in DPP-IV activity and the dramatic intracellular accumulation of the enzyme (see Fig. 3, h and Fig. 4, d) can be explained by the fact that the results refer to the specific activity of the enzyme and that other glycoproteins also accumulate. This discrepancy disappears when DPP-IV activity is expressed as mU/106 cells, the values being then 25 ± 1 and 150 ± 6 in control and treated cells, respectively.
Figure 6
Figure 6
Reversibility of the effects of GalNAc-α-O-benzyl on cell morphology, distribution of DPP-IV, and mucus secretion. HT29-RevMTX10−6 cells were cultured until day 15 in the presence of 2 mM GalNAc-α-O-benzyl and then in drug-free medium. Cultures were analyzed on day 15 (a–c), and 5 d after removal of the drug: (d–f). Left column, thin sections of the cell layer; middle column, indirect immunofluorescence detection of DPP-IV with mAb 3/775/42; right column, indirect immunofluorescence detection of mucus with pAb L56/C in sections of the cell layer. Similar results for DPP-IV were observed as for MUC1 and CEA (data not shown). Bars: left column (16 μm); middle and right columns (80 μm).
Figure 7
Figure 7
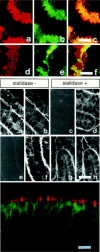
Evidence that NeuAcα2-3Galβ1-3GalNAcα1-O-Ser/Thr is the main oligosaccharide species associated with mucins and apical proteins from differentiated HT-29 cells. Top panel: cryostat sections of cell layers from HT-29 mucus-secreting cells (HT29-RevMTX10−6) were analyzed after 21 d in culture by double immunofluorescence labeling with antigastric mucus Ab L56/C followed by rhodamine-coupled Ig (a and d) and fluorescein-coupled MAA (b) and PNA lectins (e). In c and f, a mixed filter for rhodamine and fluorescein was used. (a–c) Double labeling with Ab L56/C and MAA, showing that the totality of the mucus droplets reacts with MAA; (d–f), double labeling with Ab L56/C and PNA showing that only a small proportion of mucus droplets reacts with PNA. Middle panel (a–h): apical reactivity to MAA and PNA of enterocyte-like HT-29 cells. Frozen cryostat sections from postconfluent (day 21) HT29-RevMTX10−3 cells, treated or not treated with sialidase, were double labeled with fluorescein-conjugated MAA (a and c) or PNA (e and g) and antibodies against villin (b, d, f, and h), used as an apical marker, using rhodamine-coupled Ig as a second antibody. Note in sialidase-treated sections, the disappearance of MAA staining (c) contrasting with the appearance of an apical reactivity to PNA (g). Bottom panel: confocal microscopy analysis of postconfluent HT29-RevMTX10−6 cells (day 21). A section perpendicular to the cell layer was coimmunostained by MAA (red) and mAb TS2/16 against β1 integrin (green). Note the absence of basolateral reactivity to MAA. A similar basolateral pattern as observed with mAb TS2/16 was obtained with mAb G1/136 against GP120 (data not shown). Bars: top and middle panels (40 μm); bottom panel (12 μm).
Figure 8
Figure 8
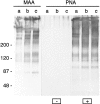
Top panel: Western blot analysis of the reactivity to MAA and PNA of cell extracts from differentiated mucus-secreting HT-29 cells. Cell homogenates from postconfluent HT-29-RevMTX10−6 cells were analyzed after (a) 15, (b) 20, and (c) 25 d in culture for their reactivity to MAA and PNA, without or after desialylation of the blot with Clostridium perfringens sialidase. The position of the prestained molecular weight markers is indicated on the left side of the panel. Bottom panel: expression of ST3Gal I. Northern blot analysis of ST3Gal I mRNA in exponentially growing (day 5) and postconfluent (day 20) HT29-RevMTX10−3 (A) and RevMTX10−6 cells (B). The same filter was dehybridized and stained with methylene blue for RNA quantification; only the 28s are shown here. The histogram represents activity (expressed in nmol.mg−1.h−1) of ST3Gal I during the course (from day 3 to 21) in culture of HT29-RevMTX10−6 cells.
Figure 8
Figure 8
Top panel: Western blot analysis of the reactivity to MAA and PNA of cell extracts from differentiated mucus-secreting HT-29 cells. Cell homogenates from postconfluent HT-29-RevMTX10−6 cells were analyzed after (a) 15, (b) 20, and (c) 25 d in culture for their reactivity to MAA and PNA, without or after desialylation of the blot with Clostridium perfringens sialidase. The position of the prestained molecular weight markers is indicated on the left side of the panel. Bottom panel: expression of ST3Gal I. Northern blot analysis of ST3Gal I mRNA in exponentially growing (day 5) and postconfluent (day 20) HT29-RevMTX10−3 (A) and RevMTX10−6 cells (B). The same filter was dehybridized and stained with methylene blue for RNA quantification; only the 28s are shown here. The histogram represents activity (expressed in nmol.mg−1.h−1) of ST3Gal I during the course (from day 3 to 21) in culture of HT29-RevMTX10−6 cells.
Figure 10
Figure 10
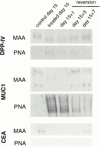
Western blot analysis with MAA and PNA lectins of immunoprecipitated DPP-IV, MUC1, and CEA from control, GalNAc-α-O-benzyl–treated cells and cells reverted to drug-free medium. DPP-IV, MUC1, and CEA were immunoprecipitated from cell homogenates with mAbs 3/775/42, BC-2, and 517, respectively. Note that in control cells DPP-IV, MUC1, and CEA react with MAA, but not with PNA. In treated cells, the reactivity to MAA is decreased for DPP-IV and abolished for MUC1 and CEA, whereas DPP-IV and MUC1, but not CEA, show a reactivity to PNA. The changes in treated cells are reversible upon removal of the drug.
Figure 9
Figure 9
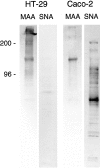
Compared Western blot analysis with MAA and SNA lectins of cell homogenates from postconfluent (day 21) HT29-RevMTX10−5 cells, using as a control postconfluent (day 21) Caco-2 cells. The same quantity of proteins (50 μg) was loaded in each lane. The samples for each lectin were run on the same gel. For clarity they have been rearranged in the figure. Note the almost total absence of SNA-reactive material in HT29 as compared with Caco-2 cells. The absence of SNA-reactivity in HT-29 cells, contrasting with the presence of SNA-reactive apical material in Caco-2 cells, was further confirmed by immunofluorescence of cell layer sections of both populations (data not shown).
Figure 11
Figure 11
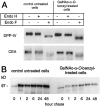
(A) Sensitivity to endoglycosidase H and endoglycosidase F of DPP-IV and CEA from control and GalNAc-α-O-benzyl-treated HT29-RevMTX10−5 cells (day 21). The same quantity of cell homogenate (30 μg of proteins) treated as indicated was loaded in each lane. Western blot analysis of DPP-IV and CEA was performed with mAbs 4H3 and 517, respectively. The samples for each protein were run on the same gel in a different order. For clarity they have been rearranged in the figure. (B) Pulse-chase experiment with DPP-IV. Control and GalNAc-α-O-benzyl–treated cells (day 21) were labeled with [35S]methionine for 15 min followed by a chase in complete medium containing unlabeled methionine. After the indicated periods of chase, DPP-IV was immunoprecipitated with mAb 4H3 and immunoprecipitates were subjected to SDS-PAGE.

Similar articles

Cited by

References

    1. Arroyo AG, Sanchez-Mateos P, Campanero MR, Martin-Padura I, Dejana E, Sanchez-Madrid F. Regulation of the VLA integrin–ligand interactions through the β1 subunit. J Cell Biol. 1992;117:659–670. - PMC - PubMed
    1. Braulke T, Mach L, Hoflack B, Glossl J. Biosynthesis and endocytosis of lysosomal enzymes in human colon carcinoma SW1116 cells: impaired internalization of plasma membrane-associated cation-independent mannose 6-phosphate receptor. Arch Biochem Biophys. 1992;298:176–181. - PubMed
    1. Byrd, J.C., R. Dahiya, J. Huang, and Y.S. Kim. 1995. Inhibition of mucin synthesis by benzyl-α-GalNAc in KATO III gastric cancer and Caco-2 colon cancer cells. Eur. J. Cancer. 31A:1498–1505. - PubMed
    1. Capon C, Laboisse CL, Wieruszeki JM, Maoret JJ, Augeron C, Fournet B. Oligosaccharide structures of mucins secreted by the human colonic cancer cell line CL.16E. J Biol Chem. 1992;267:19248–19257. - PubMed
    1. Chang ML, Eddy RL, Shows TB, Lau JTY. Three genes that encode human β-galactosidase α-2,3-sialyltransferases. Structural analysis and chromosomal lapping studies. Glycobiology. 1995;5:319–325. - PubMed

Publication types