. 1998 Jun 15;141(6):1407-14.
doi: 10.1083/jcb.141.6.1407.

OCI-5/GPC3, a glypican encoded by a gene that is mutated in the Simpson-Golabi-Behmel overgrowth syndrome, induces apoptosis in a cell line-specific manner

Affiliations

OCI-5/GPC3, a glypican encoded by a gene that is mutated in the Simpson-Golabi-Behmel overgrowth syndrome, induces apoptosis in a cell line-specific manner

A D Gonzalez et al. J Cell Biol. .

Abstract

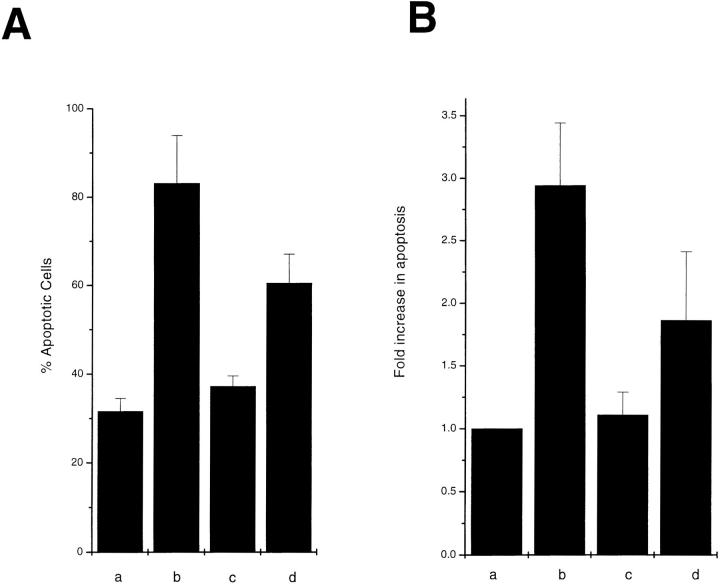
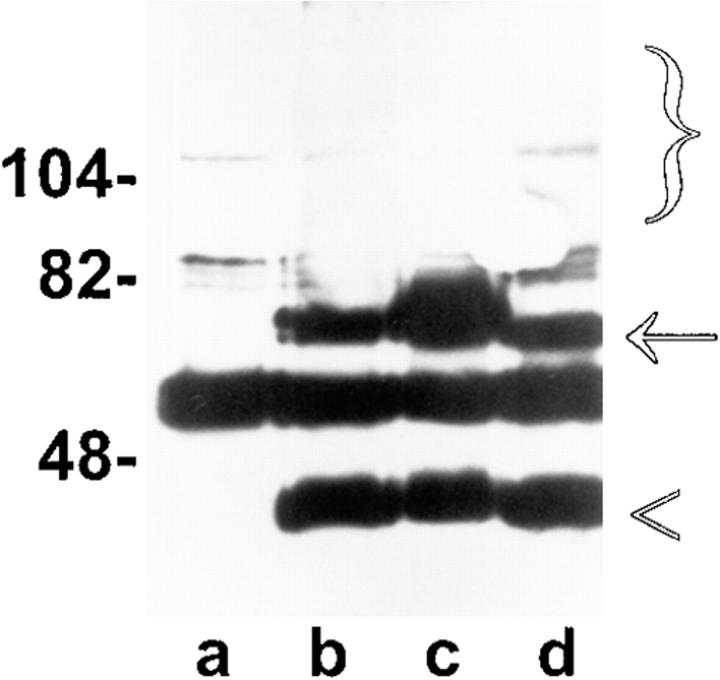
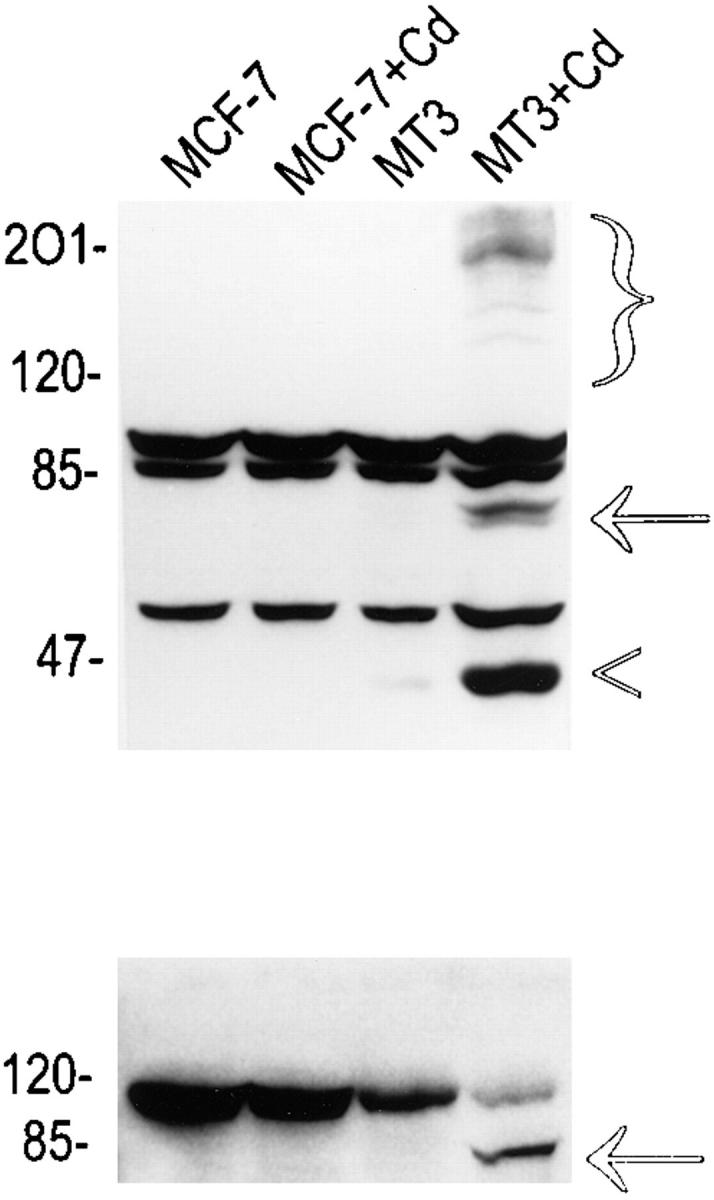
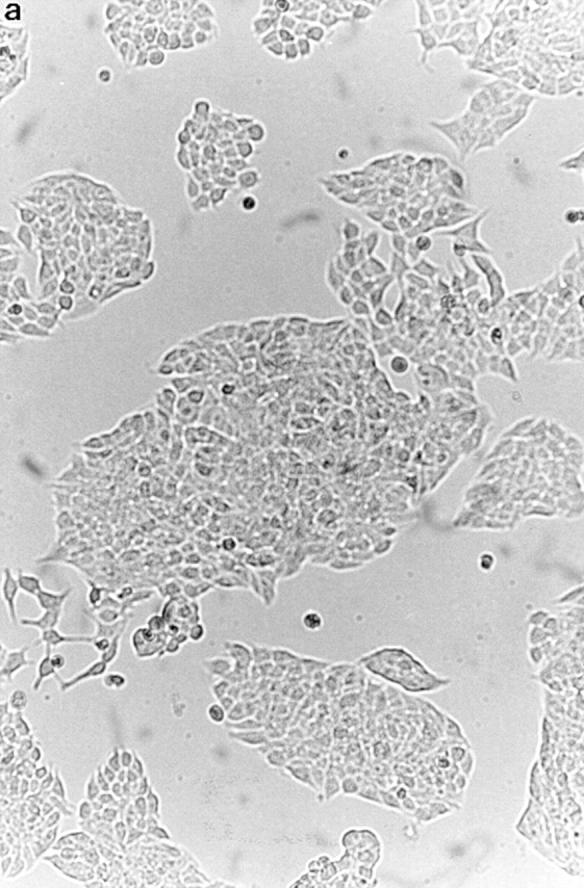
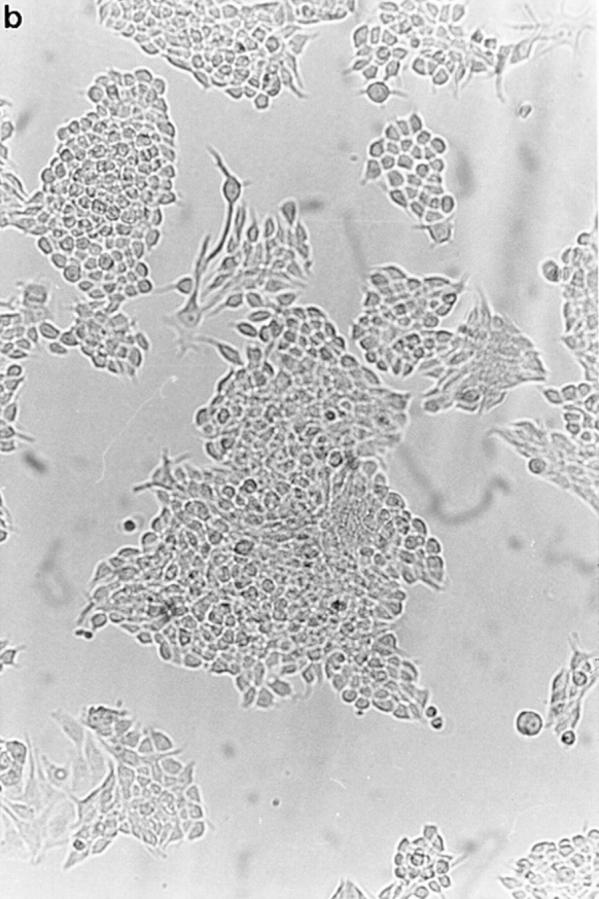
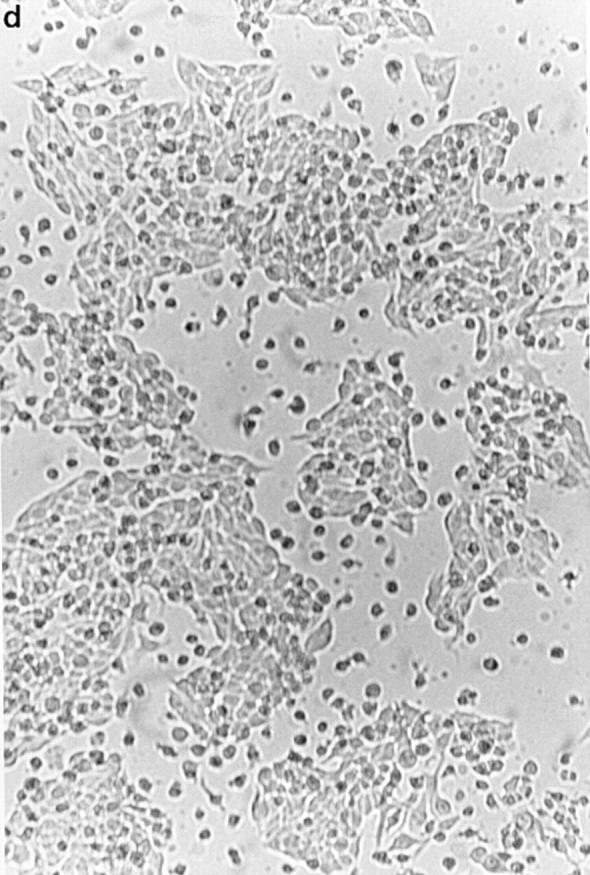
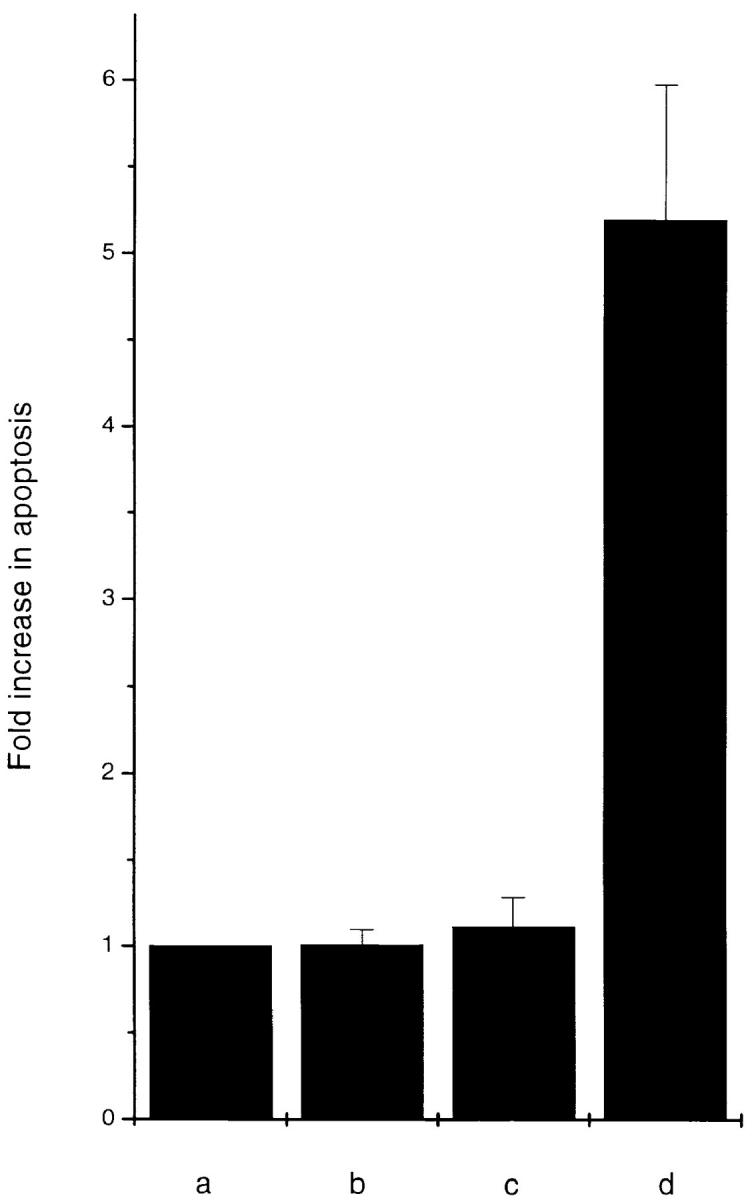
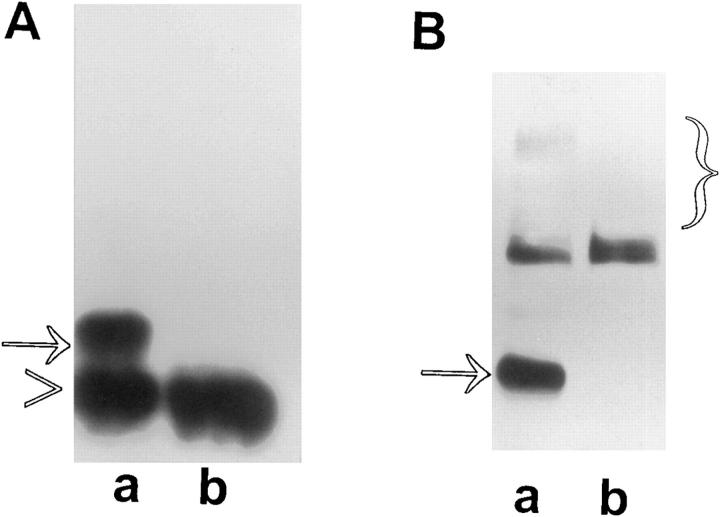
OCI-5/GPC3 is a member of the glypican family. Glypicans are heparan sulfate proteoglycans that are bound to the cell surface through a glycosyl-phosphatidylinositol anchor. It has recently been shown that the OCI-5/GPC3 gene is mutated in patients with the Simpson-Golabi-Behmel Syndrome (SGBS), an X-linked disorder characterized by pre- and postnatal overgrowth and various visceral and skeletal dysmorphisms. Some of these dysmorphisms could be the result of deficient growth inhibition or apoptosis in certain cell types during development. Here we present evidence indicating that OCI-5/GPC3 induces apoptosis in cell lines derived from mesothelioma (II14) and breast cancer (MCF-7). This induction, however, is cell line specific since it is not observed in NIH 3T3 fibroblasts or HT-29 colorectal tumor cells. We also show that the apoptosis-inducing activity in II14 and MCF-7 cells requires the anchoring of OCI-5/GPC3 to the cell membrane. The glycosaminoglycan chains, on the other hand, are not required. MCF-7 cells can be rescued from OCI-5/GPC3-induced cell death by insulin-like growth factor 2. This factor has been implicated in Beckwith-Wiedemann, an overgrowth syndrome that has many similarities with SGBS. The discovery that OCI-5/GPC3 is able to induce apoptosis in a cell line- specific manner provides an insight into the mechanism that, at least in part, is responsible for the phenotype of SGBS patients.


Figures

Figure 1
Figure 1
Transient expression assay in MCF-7 cells. MCF-7 cells were transiently transfected with RSV β-galactosidase and a fivefold excess of (a) vector control, (b) OCI-5/ GPC3, (c) ΔOCI-5/GPC3, and (d) OCI-5/ GPC3Δ (GAG). (A) 48 h after transfection, cells were fixed and stained with X-gal. Every vector was transfected into triplicate plates. The results (mean ± standard error) were expressed as percentage of rounded (apoptotic) cells among the blue-stained cells. The experiment was repeated three times with similar results. (B) 48 h after transfection, cytoplasmic extracts from equal number of cells were prepared, and the amount of DNA–histone complexes was measured by the Cell Death Elisa Assay. Every vector was transfected into triplicate plates. The results (mean ± standard error) are expressed as fold increase in apoptosis (as measured by OD at 405 nm) compared with cells transfected with vector control.
Figure 2
Figure 2
Expression of OCI-5/ GPC3 in transiently transfected MCF-7 cells. Equal numbers of cells were transfected with the indicated HA-tagged OCI-5/GPC3 expression vectors. 48 h later cells were lysed, and OCI-5/ GPC3 was immunoprecipitated with an anti-HA 12CA5 antibody. The immunoprecipitates were then analyzed by Western blot with the same antibody. Lane a, untransfected controls; lane b, OCI-5/ GPC3; lane c, OCI-5/GPC3 ΔGAG; lane d, ΔOCI-5/GPC3. The bracket indicates glycanated OCI-5/GPC3, the arrow the core protein, and the arrowhead a cleaved fragment of the core protein. Numbers on the left represent molecular mass markers expressed in kD.
Figure 3
Figure 3
Western blot analysis of MCF-7 cells expressing inducible OCI-5/GPC3. (Top) OCI-5/GPC3. Bracket, glycanated OCI-5/GPC3; arrow, core protein; arrowhead, cleavage product of core protein. (Bottom) PARP. The arrow indicates the cleavage product of PARP. Numbers on the left represent molecular mass markers expressed in kD.
Figure 4
Figure 4
Effect of inducible OCI-5/GPC3 expression on MCF-7 cells. Cells were incubated in regular medium with (b and d) and without (a and c) 5 μM CdCl2 for 4 d and photographed. (a and b) MCF-7 cells. (c and d) MT3 cells.
Figure 4
Figure 4
Effect of inducible OCI-5/GPC3 expression on MCF-7 cells. Cells were incubated in regular medium with (b and d) and without (a and c) 5 μM CdCl2 for 4 d and photographed. (a and b) MCF-7 cells. (c and d) MT3 cells.
Figure 4
Figure 4
Effect of inducible OCI-5/GPC3 expression on MCF-7 cells. Cells were incubated in regular medium with (b and d) and without (a and c) 5 μM CdCl2 for 4 d and photographed. (a and b) MCF-7 cells. (c and d) MT3 cells.
Figure 4
Figure 4
Effect of inducible OCI-5/GPC3 expression on MCF-7 cells. Cells were incubated in regular medium with (b and d) and without (a and c) 5 μM CdCl2 for 4 d and photographed. (a and b) MCF-7 cells. (c and d) MT3 cells.
Figure 5
Figure 5
Cell Death Elisa Assay of MCF-7 cells expressing inducible OCI-5/ GPC3. (a) MCF-7 cells, (b) MCF-7 cells + 5 μM Cd2+, (c) MT3 cells, (d) MT3 + 5 μM Cd2+. Every cell line was tested in triplicate plates. The results (mean ± standard error) are expressed as fold increase in apoptosis (as measured by OD at 405 nm) compared with noninduced MCF-7 cells.
Figure 6
Figure 6
Western blot analysis of OCI-5/GPC3 expression in transfected II14 cells. Lane a, parental II14 cells; lanes b–d, clones transfected with OCI-5/GPC3. Bracket, glycanated OCI-5/GPC3; arrow, core protein; arrowhead, cleavage product of core protein. Numbers on the left represent molecular mass markers.
Figure 7
Figure 7
Western blot analysis of endogenous OCI-5/GPC3 expression. (A) Normal NRM2 rat mesothelial cells (lane a) and II14 mesothelioma cells (lane b) were lysed, and OCI-5 was immunoprecipitated with 10 μg/ml of affinity-purified anti–OCI-5 polyclonal antibody. The immunoprecipitated material was analyzed by Western blot using the same antibody (1 μg/ml). The arrow indicates the OCI-5/GPC3 core protein, and the arrowhead indicates the Ig band. The glycanated form of OCI-5 could not be detected in the conditions used here. (B) HepG2 hepatoma cells (lane a) and COS-1 fibroblasts (lane b) were lysed, and expression of OCI-5/GPC3 was analyzed by Western blot with 1 μg/ml of affinity-purified anti-GPC3 polyclonal antibody. The arrow indicates the GPC3 core protein, and the bracket indicates the glycanated GPC3.
Figure 8
Figure 8
Effect of OCI-5/GPC3 expression in II14 cells. Cells were incubated in serum-free conditions for 48 h, and the number of floating cells was counted. Results are the mean value ± standard error of triplicates. (a) II14 cells. (b and c) Clones transfected with vector alone. (d–f) Clones expressing OCI-5/GPC3.
Figure 9
Figure 9
Western blot analysis of GPI domain-deletion mutant. cell, immunoprecipitated cell lysates: (lane a) Cells transfected with vector alone; (lane b) cells transfected with wild-type OCI-5/ GPC3; (lane c) cells transfected with ΔOCI-5/GPC3. sup, conditioned media: (lane a) Cells transfected with wild-type OCI-5/GPC3; (lane b) cells transfected with ΔOCI-5/GPC3. Numbers on the middle represent molecular mass markers.
Figure 10
Figure 10
Analysis of GAG-deleted mutants by immunoprecipitation of [35S]sulfate-labeled cells. Cells were transfected with: lane a, vector alone; lane b, wild-type OCI-5/GPC3; lane c, serine 494 to alanine mutant; lane d, serine 508 to alanine mutant; lane e, serines 494 and 508 to alanines mutant. Numbers on the left represent molecular mass markers.
Figure 11
Figure 11
Effect of growth factors on OCI-5/GPC-3–induced apoptosis of MCF-7 cells. OCI-5/GPC3 expression was induced by adding 5 μM Cd2+ to the MT3 cells. 2 d later, 50 ng/ml of IGF-1, IGF-2, EGF, and FGF-1 were added, and cells were incubated for two more days in the presence of the inducer and the added factors. Every factor was tested in triplicate plates. The results (mean ± standard error) are expressed as fold increase in apoptosis (as measured by OD at 405 nm) compared with noninduced MT-3 cells (Cont.).

Similar articles

Cited by

References

    1. Baker SJ, Markowitz S, Fearon ER, Willson JKV, Vogelstein B. Suppression of human colorectal carcinoma cell growth by wild-type p53. Science. 1990;249:912–915. - PubMed
    1. Bonneh-Barkay D, Shlissel M, Berman B, Shaoul E, Admon A, Vlodavsky I, Carey DJ, Asundi VK, Reich-Slotky R, Ron D. Identification of glypican as a dual modulator of the biological activity of fibroblast growth factors. J Biol Chem. 1997;272:12415–12421. - PubMed
    1. Brodsky RA, Vala MS, Barber JP, Medof ME, Jones RJ. Resistance to apoptosis caused by PIG-A gene mutations in paroxysmal nocturnal hemoglobinuria. Proc Natl Acad Sci USA. 1997;94:8756–8760. - PMC - PubMed
    1. Cadwell, R.C., and G.F. Joyce. 1995. Mutagenesis by PCR. In PCR Primer, a Laboratory Manual. C.W. Dieffenbach and G.S. Dveksler, editors. Cold Spring Harbor Laboratory Press, Cold Spring Harbor, NY. 581–613.
    1. Carey DJ, Evans DM. Membrane anchoring of heparan sulfate proteoglycans by phosphatidylinositol and kinetics of synthesis of peripheral and detergent-solubilized proteoglycans in Schwann cells. J Cell Biol. 1989;108:1891–1897. - PMC - PubMed

Publication types

MeSH terms