

Higher temporal variability of forest breeding bird communities in fragmented landscapes
- PMID: 9636178
- PMCID: PMC22664
- DOI: 10.1073/pnas.95.13.7497
Higher temporal variability of forest breeding bird communities in fragmented landscapes
Abstract
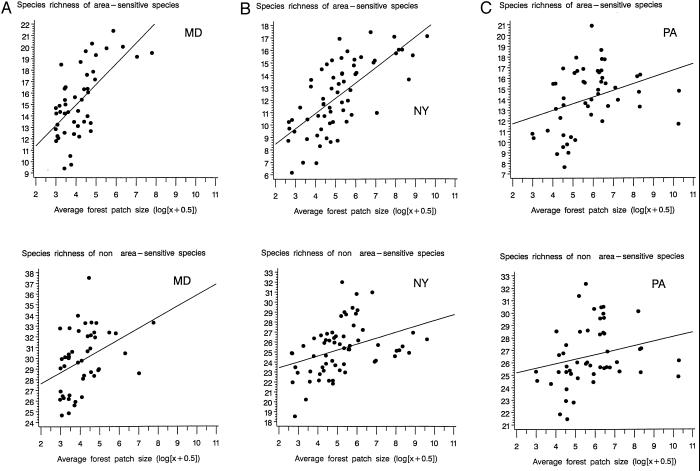
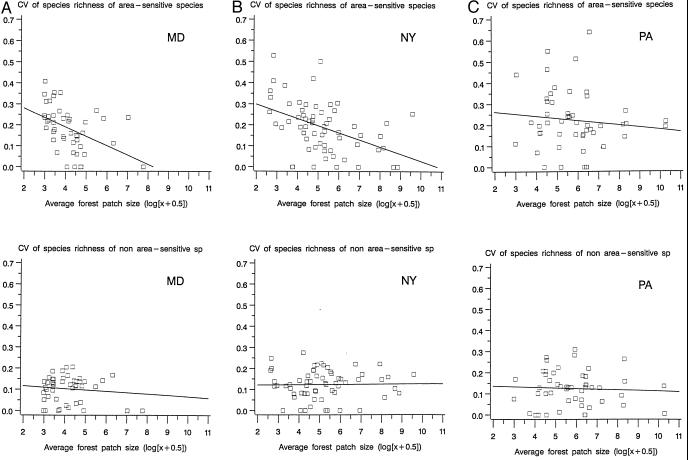
Understanding the relationship between animal community dynamics and landscape structure has become a priority for biodiversity conservation. In particular, predicting the effects of habitat destruction that confine species to networks of small patches is an important prerequisite to conservation plan development. Theoretical models that predict the occurrence of species in fragmented landscapes, and relationships between stability and diversity do exist. However, reliable empirical investigations of the dynamics of biodiversity have been prevented by differences in species detection probabilities among landscapes. Using long-term data sampled at a large spatial scale in conjunction with a capture-recapture approach, we developed estimates of parameters of community changes over a 22-year period for forest breeding birds in selected areas of the eastern United States. We show that forest fragmentation was associated not only with a reduced number of forest bird species, but also with increased temporal variability in the number of species. This higher temporal variability was associated with higher local extinction and turnover rates. These results have major conservation implications. Moreover, the approach used provides a practical tool for the study of the dynamics of biodiversity.
Figures
References
-
- Wilson E O. Biodiversity. Washington, DC: Natl. Acad. Press; 1988.
-
- Ehrlich P R, Daily G C. Ambio. 1993;22:64–68.
-
- Pimm S L, Russell G J, Gittleman J L, Brooks T M. Science. 1995;269:347–350. - PubMed
-
- Andrén H. Oikos. 1994;71:355–366.
-
- Opdam P. Land Ecol. 1991;5:93–106.
LinkOut - more resources
Full Text Sources
