. 1998 Jun 23;95(13):7693-8.
doi: 10.1073/pnas.95.13.7693.

Cyclic AMP regulates potassium channel expression in C6 glioma by destabilizing Kv1.1 mRNA

Affiliations

Cyclic AMP regulates potassium channel expression in C6 glioma by destabilizing Kv1.1 mRNA

M L Allen et al. Proc Natl Acad Sci U S A. .

Abstract

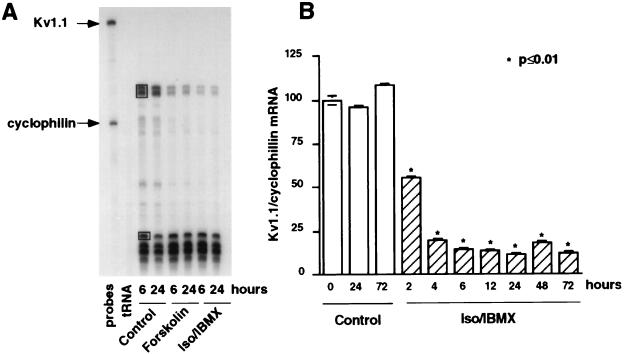
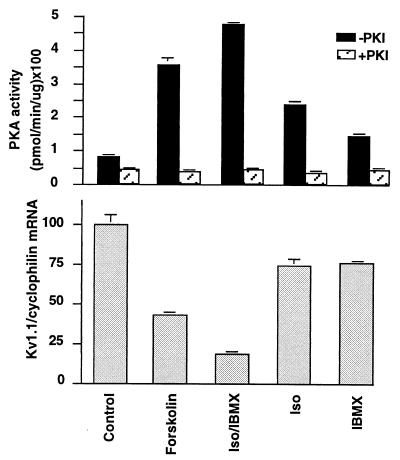
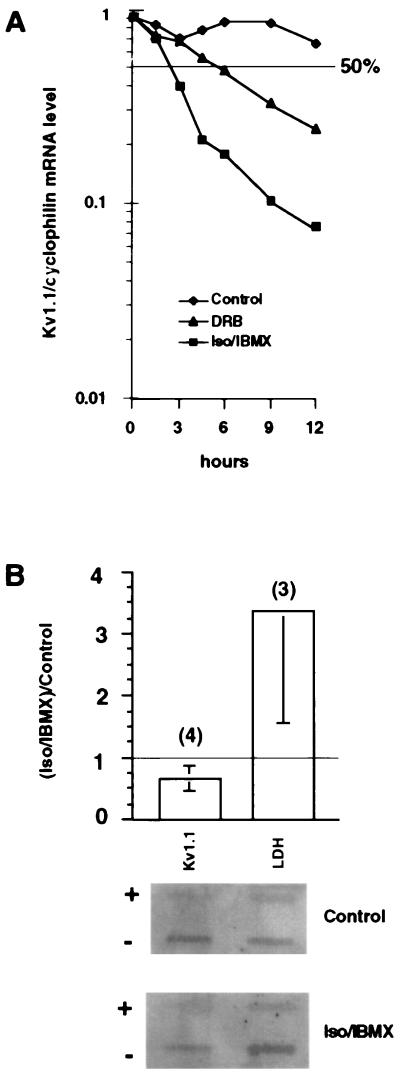
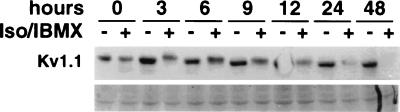
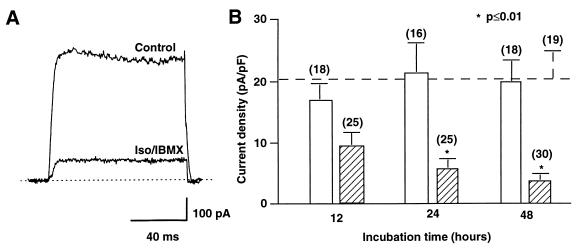
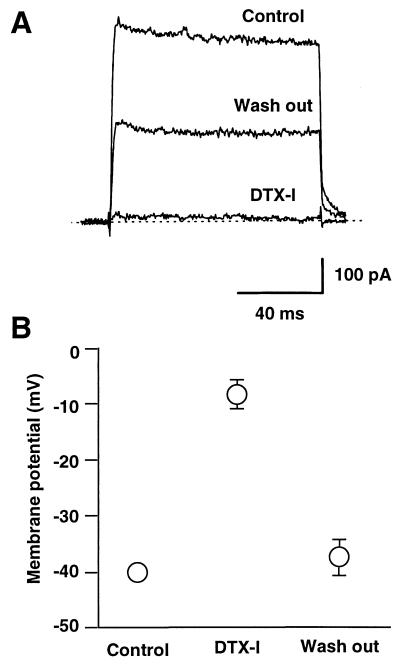
The tissue distributions and physiological properties of a variety of cloned voltage-gated potassium channel genes have been characterized extensively, yet relatively little is known about the mechanisms controlling expression of these genes. Here, we report studies on the regulation of Kv1.1 expressed endogenously in the C6 glioma cell line. We demonstrate that elevation of intracellular cAMP leads to the accelerated degradation of Kv1.1 RNA. The cAMP-induced decrease in Kv1.1 RNA is followed by a decrease in Kv1. 1 protein and a decrease in the whole cell sustained K+ current amplitude. Dendrotoxin-I, a relatively specific blocker of Kv1.1, blocks 96% of the sustained K+ current in glioma cells, causing a shift in the resting membrane potential from -40 mV to -7 mV. These data suggest that expression of Kv1.1 contributes to setting the resting membrane potential in undifferentiated glioma cells. We therefore suggest that receptor-mediated elevation of cAMP reduces outward K+ current density by acting at the translational level to destabilize Kv1.1 RNA, an additional mechanism for regulating potassium channel gene expression.


Figures

Figure 1
Figure 1
Kv1.1 RNA level decreases with elevation of intracellular cAMP. (A) A representative RPA gel showing single samples at 6 and 24 h for control, forskolin, and Iso/IBMX-treated cultures. Undigested, full-length probes (Kv1.1 and cyclophilin) are indicated. Protected bands that were quantitated are boxed in the third lane. The mouse Kv1.1 probe protected two bands in rat-derived C6 glioma. Cyclophilin consistently gave a single band with a smear below. The largest cyclophilin band was used to quantify changes in Kv1.1 RNA levels. (B) Kv1.1 RNA levels in C6 glioma were treated with vehicle (control) or Iso/IBMX for up to 72 h. Triplicate plates were collected for each treatment group. Cyclophilin levels were unchanged over 12 h but declined in both treated and control samples collected at 24, 48, and 72 h. Kv1.1 levels did not change significantly over 72 h in control samples. Therefore, the data have been corrected to the cyclophilin levels at 0 h. Statistical analysis included a one-way ANOVA followed by a Tukey’s multiple comparison test.
Figure 2
Figure 2
PKA activity and Kv1.1 RNA levels are inversely correlated. Paired sets of C6 glioma cultures were treated with the indicated pharmacological agents for 6 h and then harvested for PKA activity assays (Upper) and RPA assays (Lower). See methods for details.
Figure 3
Figure 3
Elevation of cAMP affects the rate of Kv1.1 RNA degradation with only a small affect on transcription of Kv1.1. (A) Kv1.1 RNA half-life was determined by initiating pharmacological treatments on duplicate cultures/treatment/time point and harvesting RNA at the indicated times. RPA analysis was used to follow Kv1.1 RNA levels relative to cyclophilin. Cyclophilin levels did not change significantly with any of these treatments at any of these time points. Error bars are not shown because error was ≤2% at each time point. Half-life measurements were made by plotting results on a semi-log plot (50% level indicated by the thin horizontal line.) Three independent experiments, with n = 2 for each treatment at each time point, were conducted with the same results. (B) For nuclear run-on transcription assays, nuclei were prepared from cells treated for 6 h with vehicle (control) or Iso/IBMX. Quantitation represents the average of the ratio of Iso/IBMX over control for the antisense strand with the number of measurements indicated above the bar. Standard deviation for Kv1.1 = 0.23 and for LDH = 1.82. No change would be equal to 1.0 as indicated by the horizontal line on the graph. The radiographic image is one representative experiment. The (+) indicates the sense strand probe, and the (−) indicates the antisense strand probe.
Figure 4
Figure 4
Elevation of cAMP decreases Kv1.1 protein. Cells were treated with vehicle (control) or Iso/IBMX for the indicated times, and a crude membrane fraction was prepared. Western blot analysis (Upper) was performed with a polyclonal antibody that specifically recognizes Kv1.1 protein (21). Equal amounts of protein were loaded per lane as evidenced by a prominent 51-kDa band of a Coomassie-stained paired gel (Lower).
Figure 5
Figure 5
Elevation of intracellular cAMP level decreases K+ current density. (A) Representative K+ currents in a cell treated with vehicle (control) and in another cell treated with Iso/IBMX for 48 h. Currents were elicited by a voltage step from −70 mV to 0 mV in whole-cell configuration. Recordings with typical level of currents were selected for illustration. Membrane capacitance was 20 pF for the control and 15 pF for the treated cell. (B) Summary of current density in control cells (open bar) or in cells treated with Iso/IBMX (hatched bar) for various incubation times. For the group labeled 12 h, cells were patch-clamped between 10 and 14 h after the start of treatments. Cells were measured between 21 and 27 h for the group labeled 24 h and between 45 and 51 h for the group labeled 48 h. Current density was calculated as current at 0 mV divided by membrane capacitance. Dashed line indicates the current density of control cells at 0 h. Number of cells measured for each condition is given in parentheses.
Figure 6
Figure 6
Potassium currents and the resting membrane potential in C6 glioma cells are sensitive to DTX-I. (A) Currents were recorded in Ringer’s solution (control) after 2 min of perfusion with 100 nM DTX-I containing Ringer’s (DTX-I) and after 3.5 min of wash out with Ringer’s (wash out). K+ currents were activated by the same voltage protocol as Fig. 5A. (B) Membrane potential in current-clamp mode (I = 0) was measured under the same conditions as A.

References

    1. Mori Y, Matsubara H, Folco E, Siegel A, Koren G. J Biol Chem. 1993;268:26482–26493. - PubMed
    1. Mori Y, Folco E, Koren G. J Biol Chem. 1995;270:27788–27796. - PubMed
    1. Takimoto K, Levitan E S. Biochemistry. 1996;35:14149–14156. - PubMed
    1. Levitan E S, Gealy R, Trimmer J S, Takimoto K. J Biol Chem. 1995;270:6036–60341. - PubMed
    1. Gan L, Perney T M, Kaczmarek L K. J Biol Chem. 1996;271:5859–5865. - PubMed

Publication types

LinkOut - more resources