. 1998 Jun 23;95(13):7715-20.
doi: 10.1073/pnas.95.13.7715.

Dynamic mapping at the laminar level of odor-elicited responses in rat olfactory bulb by functional MRI

Affiliations

Dynamic mapping at the laminar level of odor-elicited responses in rat olfactory bulb by functional MRI

X Yang et al. Proc Natl Acad Sci U S A. .

Abstract

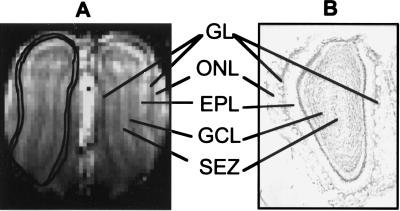
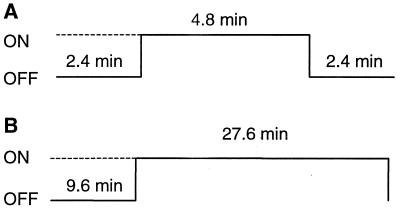
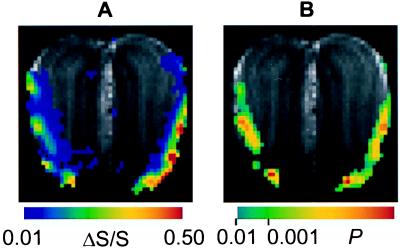
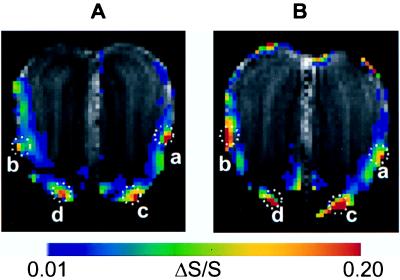
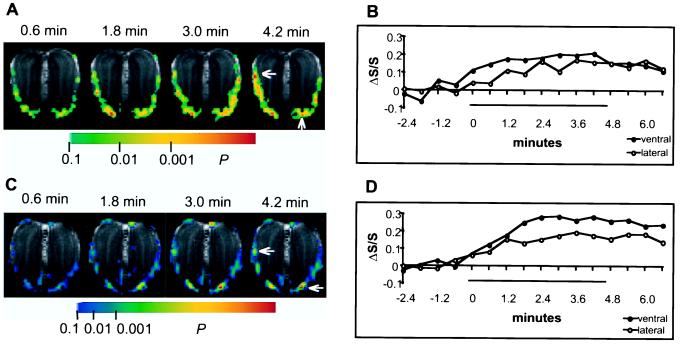
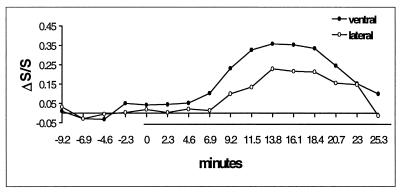
We have applied functional MRI (fMRI) based on blood oxygenation level-dependent (BOLD) image-contrast to map odor-elicited olfactory responses at the laminar level in the rat olfactory bulb (OB) elicited by iso-amyl acetate (10(-2) dilution of saturated vapor) with spatial and temporal resolutions of 220x220x1,000 micro(m) and 36 s. The laminar structure of the OB was clearly depicted by high-resolution in vivo anatomical MRI with spatial resolution of 110x110x1,000 micro(m). In repeated BOLD fMRI measurements, highly significant (P < 0.001) foci were located in the outer layers of both OBs. The occurrence of focal OB activity within a domain at the level of individual glomeruli or groups of glomeruli was corroborated on an intra- and inter-animal basis under anesthetized conditions with this noninvasive method. The dynamic studies demonstrated that the odor-elicited BOLD activations were highly reproducible on a time scale of minutes, whereas over tens of minutes the activations sometimes varied slowly. We found large BOLD signal (DeltaS/S = 10-30%) arising from the olfactory nerve layer, which is devoid of synapses and composed of unmyelinated fibers and glial cells. Our results support previous studies with other methods showing that odors elicit activity within glomerular layer domains in the mammalian OB, and extend the analysis to shorter time periods at the level of individual glomeruli or groups of glomeruli. With further improvement, BOLD fMRI should be ideal for systematic analysis of the functional significance of individual glomeruli in olfactory information encoding and of spatiotemporal processing within the olfactory system.


Figures

Figure 1
Figure 1
The in vivo anatomical MRI of a coronal slice in the rat OBs. The MRI image (A) was acquired with a T1-weighted gradient-echo sequence with in-plane resolution of 110 μm×110 μm and slice thickness of 1 mm. In comparison with a cresyl-stained histological section (slice thickness of 50 μm) from another rat (B), the ONL, GL, EPL, the granular cell layer (GCL), and the subependamal zone (SEZ) all are delineated. In the left bulb in A, the contour of the GL is outlined.
Figure 2
Figure 2
The stimulation protocols for the experiments with (A) 4.8-min and (B) 27.6-min odor exposures. The on periods indicate the duration of odor stimulation. During the off periods, the rats breathed pure air.
Figure 3
Figure 3
(A) An individual BOLD fMRI activation map (ΔS/S map, thresholded at ΔS/S ≥ 0.01) acquired in a period of 2.3 min (between 23.0 and 25.3 min after the onset of odor exposure) during a prolonged exposure of 27.6 min to iso-amyl acetate (10 −2 dilution of the saturated vapor). The magnitude of odor-elicited signal change (ΔS/S) in each pixel is indicated by the color scale. (B) The same individual activation in A is presented as a t-map thresholded at P < 0.01. The statistical significance (P value, probability of error) of the odor-elicited MRI signal change in each pixel is represented by the corresponding P value in the color scale. All of the activation maps were linearly interpolated from in-plane resolution of 220×220 μm to 110×110 μm and overlaid on the corresponding anatomical MRI.
Figure 4
Figure 4
BOLD fMRI activation maps acquired in different rats (A in rat #3, and B in rat #4). The activation maps are mean ΔS/S maps for 4.8-min continuous exposures. The laminar distribution of activated pixels within each circled area (a, b, c, and d) is summarized in Table 1.
Figure 5
Figure 5
Individual BOLD fMRI activation maps (A, rat #3; C, rat #4) acquired during 4.8-min continuous odor exposure with temporal resolution of 36 s, accompanied by the corresponding time course of the BOLD signal (ΔS/S) from single pixels (B for arrows in A, D for arrows in C) in the ventral GL and the lateral ONL. The bars in B and D represent the duration of odor stimulation, and values on the temporal axis represent the time intervals between the start of every 0.6-min acquisition and the onset of odor stimulation. Each BOLD activation map was thresholded at P < 0.1.
Figure 6
Figure 6
Time courses of the BOLD signal (ΔS/S) from single pixels (the same as in Fig. 5C) in the ventral GL, lateral ONL during a 27.6-min prolonged exposure. The bar indicates the duration of odor stimulation, and the values on the temporal axis represent the time intervals between the start of every 2.3-min acquisition and the onset of odor stimulation.

References

    1. Steward W B, Kauer J S, Shepherd G M. J Comp Neurol. 1979;185:715–734. - PubMed
    1. Greer C A, Stewart W B, Teicher M H, Shepherd G M. J Neurosci. 1982;2:1744–1759. - PMC - PubMed
    1. Jourdan F, Duveau A, Astic L, Holley A. Brain Res. 1980;188:139–154. - PubMed
    1. Astic L, Saucier D. Brain Res Bull. 1986;16:445–454. - PubMed
    1. Mori K, Mataga N, Imamura K. J Neurophysiol. 1992;67:786–789. - PubMed

Publication types

LinkOut - more resources