. 1998 Jun 23;95(13):7789-94.
doi: 10.1073/pnas.95.13.7789.

Conformational changes couple Na+ and glucose transport

Affiliations

Conformational changes couple Na+ and glucose transport

D D Loo et al. Proc Natl Acad Sci U S A. .

Abstract

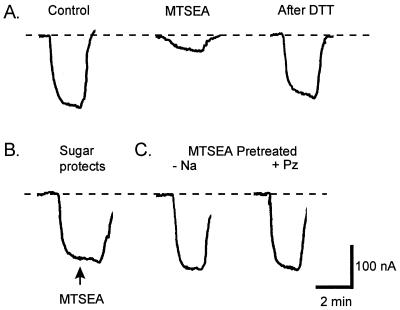
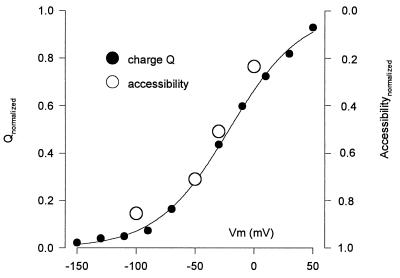
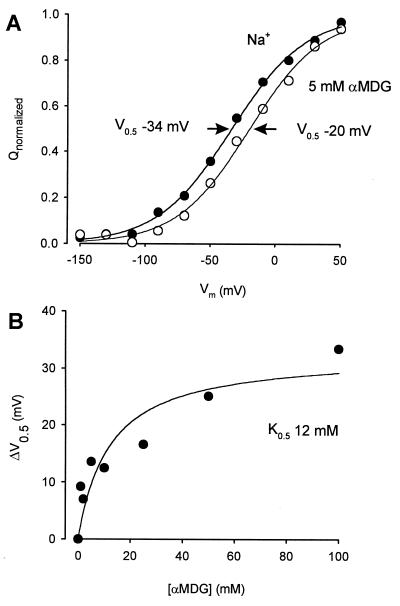
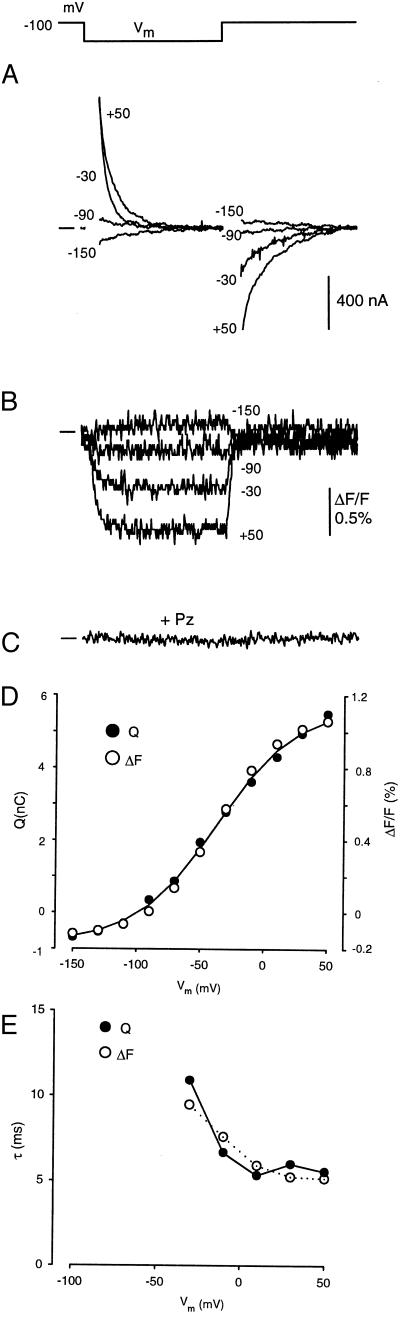
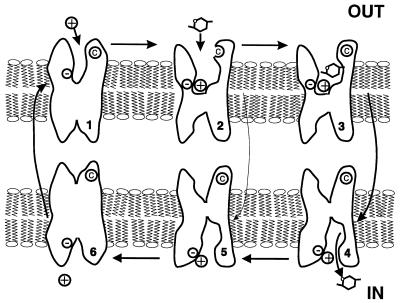
The mechanism by which cotransport proteins couple their substrates across cell membranes is not known. A commonly proposed model is that cotransport results from ligand-induced conformational transitions that change the accessibility of ligand-binding sites from one side of the membrane to the other. To test this model, we have measured the accessibility of covalent probes to a cysteine residue (Q457C) placed in the putative sugar-translocation domain of the Na+/glucose cotransporter (SGLT1). The mutant protein Q457C was able to transport sugar, but transport was abolished after alkylation by methanethiosulfonate reagents. Alkylation blocked sugar translocation but not sugar binding. Accessibility of Q457C to alkylating reagents required external Na+ and was blocked by external sugar and phlorizin. The voltage dependence of accessibility was directly correlated with the presteady-state charge movement of SGLT1. Voltage-jump experiments with rhodamine-6-maleimide-labeled Q457C showed that the time course and level of changes in fluorescence closely followed the presteady-state charge movement. We conclude that conformational changes are responsible for the coupling of Na+ and sugar transport and that Q457 plays a critical role in sugar translocation by SGLT1.


Figures

Figure 1
Figure 1
Effects of substrates on MTSEA labeling of Q457C. The ability of 1 μM MTSEA to label the Q457C residue was influenced by substrate binding. A single Q457C-expressing oocyte was voltage-clamped at −50 mV in Na buffer as the composition of the bath solution was varied. Effects on Q457C function were measured as current generated by 200 mM αMDG. (A) Control. αMDG generated a current of 180 nA. After reequilibration in Na buffer, the oocyte was exposed to MTSEA for 80 sec. This resulted in inactivation of transport; the current was reduced to 40 nA. Complete recovery from MTSEA inactivation was achieved by washing the oocyte in 10 mM DTT in Na buffer for 15 min. (B) Sugar was able to prevent MTSEA inactivation. After addition of 200 mM αMDG, 1 μM MTSEA (arrow) was added to the bath for 80 sec; no reduction in current was observed. (C) There was no reduction in αMDG-induced current if the oocyte was pretreated with MTSEA in the absence of Na+ (choline replacement) or in the presence of Na+ and 100 μM phlorizin before testing for αMDG transport. Between all of the experiments, the oocyte was washed in 10 mM DTT for 15 min before equilibration in Na buffer. Dashed line indicates baseline holding current.
Figure 2
Figure 2
Correlation of the voltage dependence of Q457C accessibility and the presteady–state charge movement. Accessibility was measured as the extent of inhibition of the sugar-induced current (unity is 100%) after 1 min exposure to 10 μM MTSEA. The relative voltage sensitivity was obtained by normalizing the accessibility at the usual holding potential (−50 mV) to the charge. At each test voltage, the charge Q was obtained by integration of the presteady–state currents (see Fig. 4A). The curve was the fit of the Q/V data to the Boltzmann relation (6): (Q − Qhyp)/Qmax = 1/[1 + exp(z(V − V0.5)F/RT)]. Qmax = QdepQhyp; Qdep and Qhyp are Q at depolarizing and hyperpolarizing limits, z is apparent valence of the movable charge, V0.5 is voltage at 0.5 Qmax, F is Faraday, R is the gas constant, and T is absolute temperature. In this experiment, Qmax = 13 ± 1 nC, z = 0.8 ± 0.1, and V0.5 = −21 ± 3 mV (statistics are errors of the fit). The data has been normalized between 0 and 1.
Figure 3
Figure 3
Sugar binding to Q457C. The binding of sugar to Q457C can be studied from the effect of external sugar on the presteady–state charge movement. Sugar shifted the V0.5 of the Q/V relation. (A) The effect of sugar on Q/V relations. Normalized Q/V curves at 0 and 5 mM αMDG. The V0.5 of the Q/V curve at 5 mM αMDG shifted +14 mV. Fits to the data gave, in Na+: Qmax 13 ± 1 nC, z = 0.9 ± 0.1, V0.5 = −34 ± 2 mV; in 5 mM αMDG: Qmax = 12 ± 1 nC, z = 0.9 ± 1, and V0.5 = −20 ± 4 mV. (B) Dependence of the V0.5 on external sugar concentration. The curve was drawn according to the equation: ΔV0.5 = ΔVmax [αMDG]/(K0.5 + [αMDG]) with ΔVmax = 33 ±5 mV and K0.5 = 12 ± 6 mM.
Figure 4
Figure 4
Relationship between presteady–state charge movement of Q457C labeled with TMR6M and the quench in fluorescence. (A) Presteady–state current records. Membrane potential was stepped for 100 ms from the holding potential (−100 mV) to a series of test values from +50 to −150 mV in 20 mV decrements. The total current I was fitted to the equation: I(t) = I1exp(−t/τ1) + I2exp(−t/τ2) + Iss; where t is time, I1exp(−t/τ1) is the capacitive transient with initial value I1 and time constant τ1, I2exp(−t/τ2) is the presteady–state current of Q457C with initial value I2 and time constant τ2, and Iss is the steady–state current. Q457C presteady–state current was obtained from the total current by subtraction of the capacitive and steady–state currents (6). The solid line at the left is baseline. (B) Time course of the voltage-sensitive quench of rhodamine fluorescence. Fluorescence was monitored simultaneously in the experiment of Fig. 4A. (C) Blockade of the voltage-dependent quench of rhodamine fluorescence by phlorizin. Addition of 1 mM phlorizin (Pz) to the external solution completely and reversibly abolished the voltage-dependent fluorescence quench. Phlorizin also inhibited the presteady–state currents (not shown). The time scale is the same for A, B, and C; the pulse duration is 100 ms. (D) Comparison of the Q/V and ΔF/V relations. The smooth curve was drawn according to the Boltzmann relation with Qmax = 6.5 nC, z = 1.0, and V0.5 = −37 mV. The voltage dependence of the quench of rhodamine fluorescence was identical to that of the presteady–state charge movement. (E) Correlation between the relaxation time constants τ of presteady–state current and the quench in rhodamine fluorescence.
Figure 5
Figure 5
Cartoon of the 6-state ordered kinetic model for Na+/glucose cotransport. States 1–3 and 4–6 face the external and internal membrane surfaces, respectively. In the absence of ligands, the transporter exists in 2 states (1 and 6). At the external surface, 2 Na+ ions bind to the transporter to form the complex CNa2 (state 2). The fully loaded transporter CNa2S (state 3) undergoes a conformational change (state 3 to 4) resulting in Na+/glucose cotransport. The reaction from state 2 to 5 represents the uniport (“leak”) pathway. Presteady–state currents are due to the partial reactions: 2 ⇌ 1 ⇌ 6. Note that the cysteine © at residue 457 is only accessible in state 2, and that it most probably is not within the membrane electric field.

References

    1. Wright E M, Loo D D F, Hirayama B A, Turk E. Curr Opin Cell Biol. 1996;8:468–473. - PubMed
    1. Loo D D F, Zeuthen T, Chandy G, Wright E M. Proc Natl Acad Sci USA. 1996;93:13367–13370. - PMC - PubMed
    1. Schultz S G, Curran P F. Physiol Rev. 1970;50:637–718. - PubMed
    1. Parent L, Supplisson S, Loo D D F, Wright E M. J Membr Biol. 1992;125:63–79. - PubMed
    1. Su A, Mager S, Mayo S L, Lester H A. Biophys J. 1996;70:762–777. - PMC - PubMed

Publication types

MeSH terms

LinkOut - more resources