. 1998 Jun 15;12(12):1801-11.
doi: 10.1101/gad.12.12.1801.

Kappa chain monoallelic demethylation and the establishment of allelic exclusion

Affiliations

Kappa chain monoallelic demethylation and the establishment of allelic exclusion

R Mostoslavsky et al. Genes Dev. .

Abstract

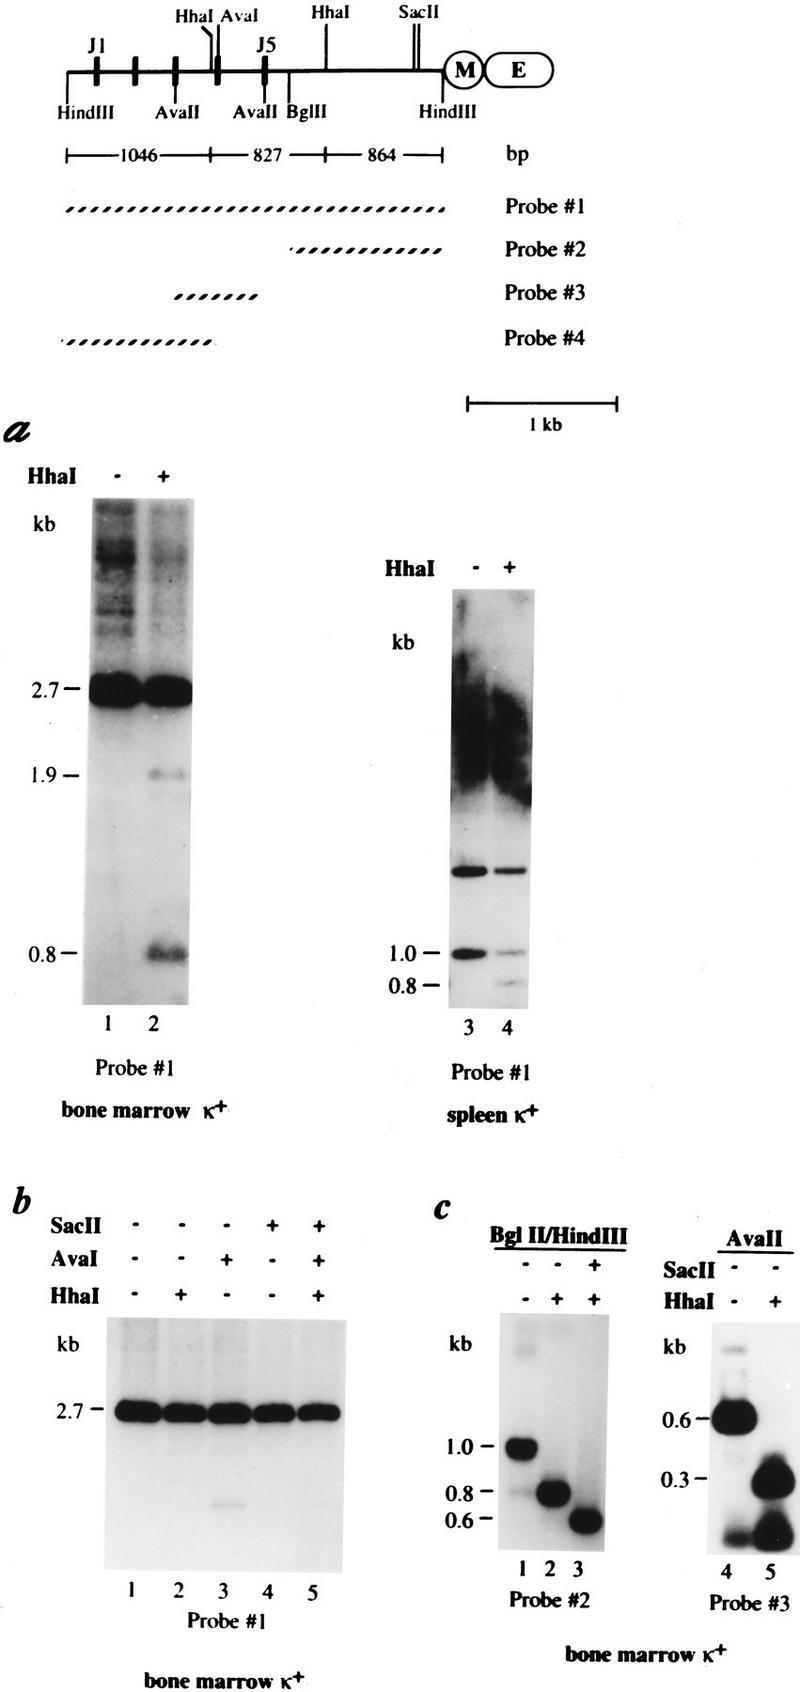
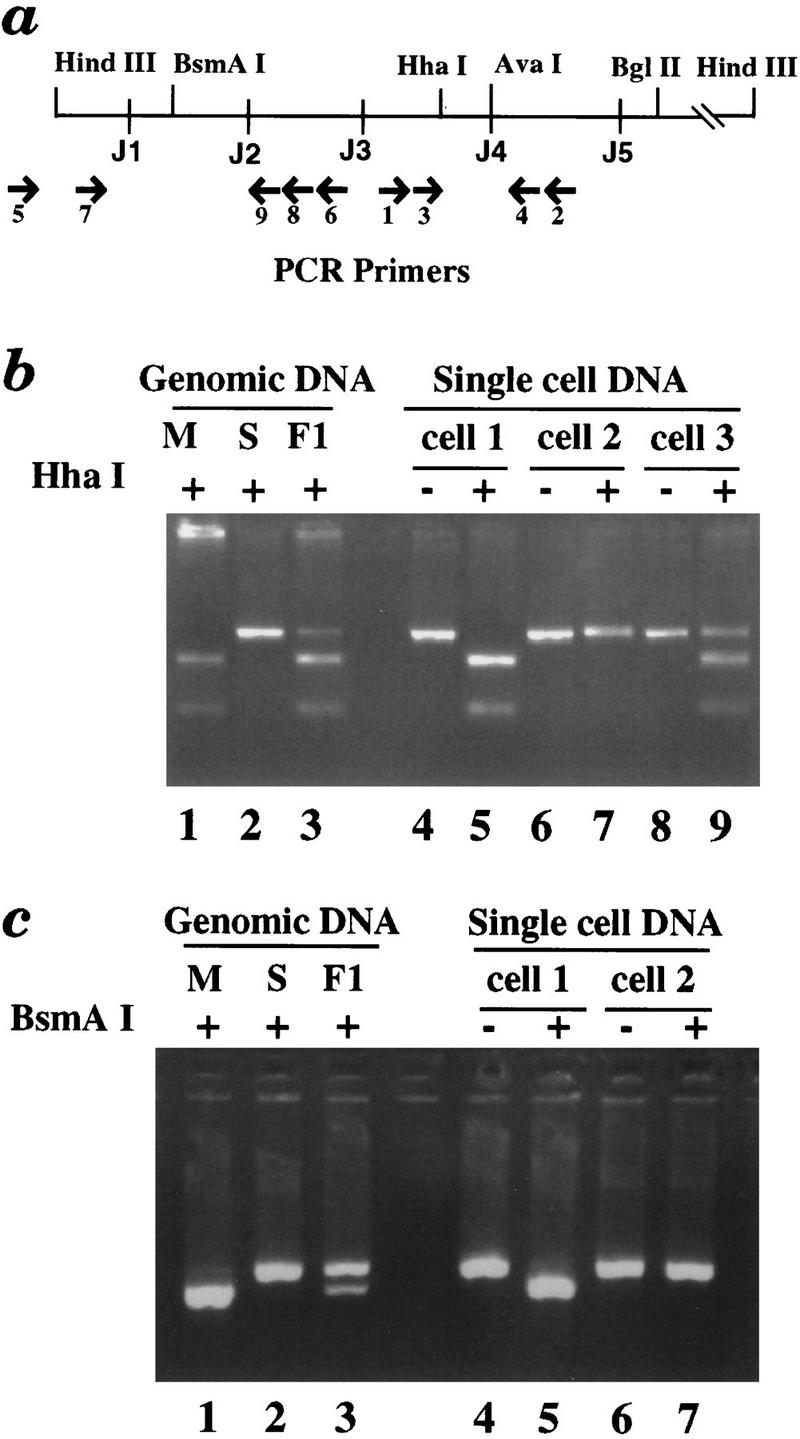
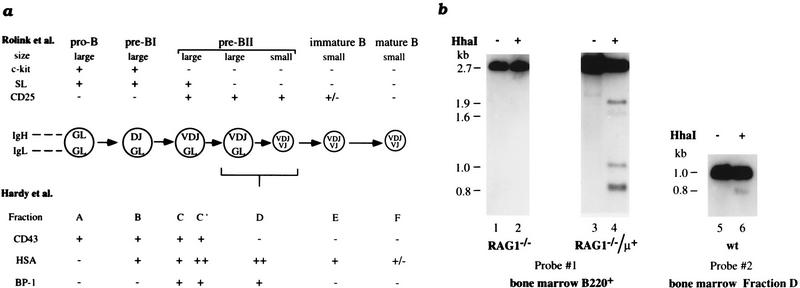
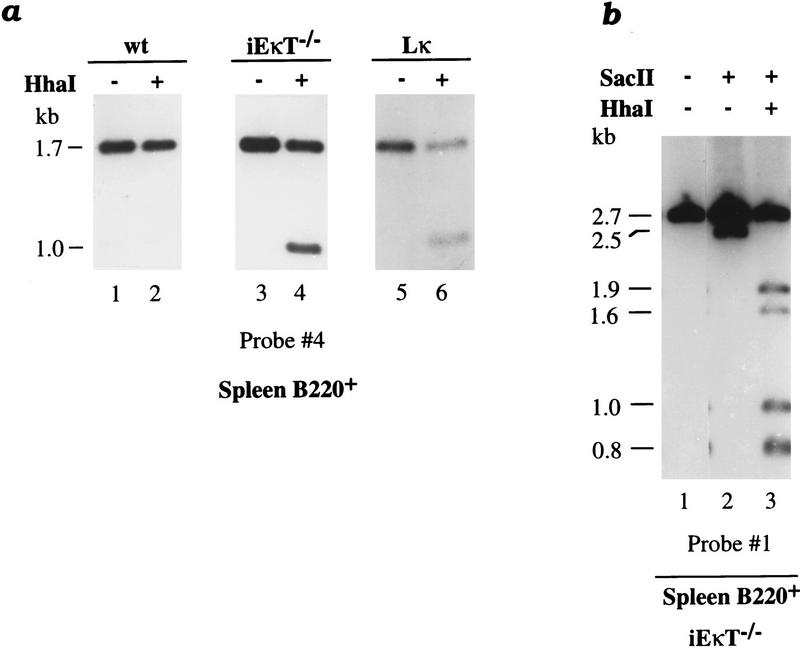
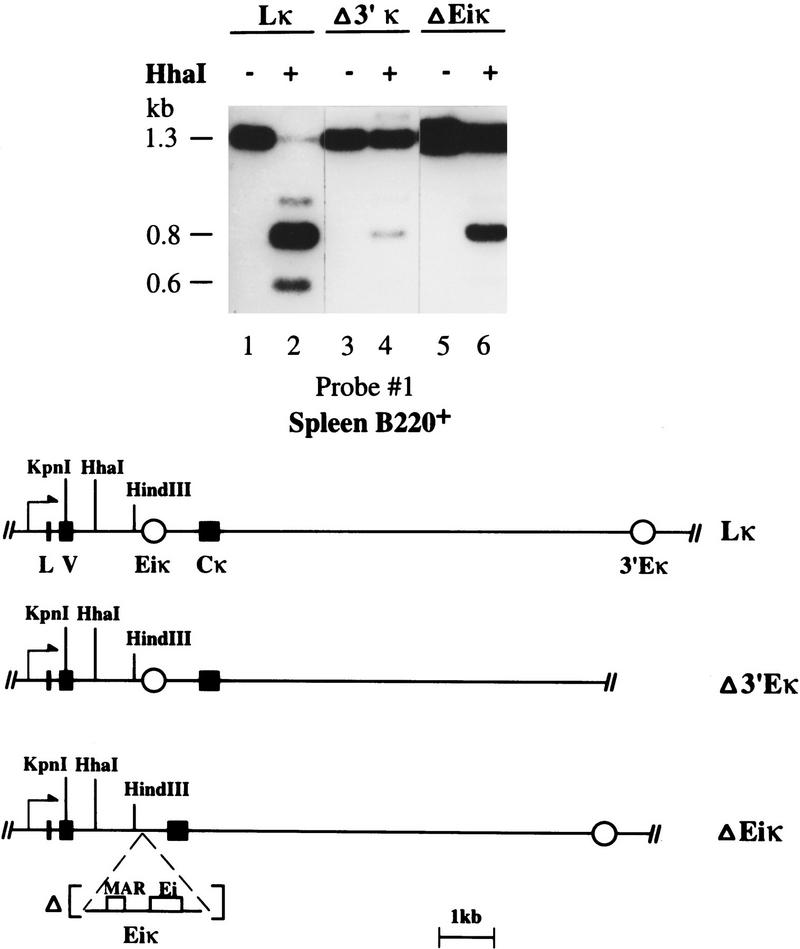
Allelic exclusion in kappa light-chain synthesis is thought to result from a feedback mechanism by which the expression of a functional kappa light chain on the surface of the B cell leads to an intracellular signal that down-regulates the V(D)J recombinase, thus precluding rearrangement of the other allele. Whereas such a feedback mechanism clearly plays a role in the maintenance of allelic exclusion, here we provide evidence suggesting that the initial establishment of allelic exclusion involves differential availability of the two kappa alleles for rearrangement. Analysis of kappa+ B-cell populations and of individual kappa+ B cells that have rearranged only one allele demonstrates that in these cells, critical sites on the rearranged allele are unmethylated, whereas the nonrearranged allele remains methylated. This pattern is apparently generated by demethylation that is initiated at the small pre-B cell stage, on a single allele, in a process that occurs prior to rearrangement and requires the presence in cis of both the intronic and 3' kappa enhancers. Taken together with data demonstrating that undermethylation is required for rearrangement, these results indicate that demethylation may actually underly the process of allelic exclusion by directing the initial choice of a single kappa allele for rearrangement.


Figures

Figure 1
Figure 1
In vivo methylation pattern of the κ chain gene. A map of the κ chain gene locus shows the J segments, the intronic MAR (M) and enhancer (E) sequences, the relevant restriction sites, fragment sizes, and the probes used in these experiments. (a) DNA from bone marrow (lanes 1,2) or spleen (lanes 3,4) κ+ cells derived from wild-type mice was digested with HindIII (lanes 1–2) or HindIII–BglII (lanes 3–4) and then tested for methylation by additional restriction with HhaI (+). These samples were then subjected to gel electrophoresis and analyzed by blot hybridization using probe 1. It should be noted that equal amounts of DNA were loaded in both lanes 1 and 2 as indicated by ethidium bromide staining (data not shown). When cut with HindIII the bone marrow DNA shows a germ-line band (2.7 kb) as well as numerous rearranged bands (seen as a smear). Full undermethylation results in 1046-, 827-, and 864-bp fragments, but partial digests can also be seen on the gel (1.6 and 1.9 kb). It should be noted that the appearance of a 1.9-kb band indicates that a small fraction of the germ-line allele is also unmethylated at some sites. Similar results were seen when DNA from κ+ spleen cells was analyzed in the same manner (data not shown). Digestion with HindIII–BglII concentrates all κ gene copies into a single band (1.0 kb), which if unmethylated is reduced to 0.8 kb when cleaved with HhaI. This site is ∼50% methylated in normal κ+ cells (lane 4). In this gel, the 1.0-kb band has a lower intensity than the 1.7-kb band, mainly because it hybridizes to a smaller part of the probe and because gel transfer is not as efficient at this molecular weight (as shown by analysis of HindIII–BglII digests of non-B-cell DNA). The upper (1.7-kb) band seen in this gel represents the 5′ HindIII–BglII fragment derived from germ-line copies of the gene. (b) DNAs from κ+ bone marrow cells were treated with HindIII and further digested with the methyl-sensitive restriction enzymes, HhaI, AvaI, or SacII and analyzed as in a. (c) Because the degree of undermethylation on the rearranged κ alleles could not be determined quantitatively from the data shown in Figure 1a, DNA was extracted (Quiagen Kit) from the smear region (>2.7 kb; a, lane 1), further digested with either BglII (lanes 1–3) or AvaII (lanes 4,5) plus methyl-sensitive restriction enzymes SacII or HhaI (indicated by a + or − at the top), and analyzed using either probe 2 or probe 3, as indicated. The resulting BglII–HindIII fragment (region covered by probe 2) yielded a 0.8- or 0.6-kb band when the respective HhaI and SacII sites are unmethylated. The AvaII fragment (region covered by probe 3) was cleaved by HhaI to yield a 0.3-kb band if unmethylated.
Figure 2
Figure 2
MSRE–PCR analysis of the κ gene in single cells. (a) A map of the Jκ region showing the location of primers used for MSRE–PCR analysis and relevant restriction enzyme sites. AvaI was used to detect DNA methylation, whereas the polymorphic HhaI and BsmAI were employed to distinguish between the two κ alleles. (b) (Lanes 1–3) As a control, genomic DNAs from M. musculus, M. spretus, or F1 mice were PCR amplified with primers P3 and P4, digested with HhaI (used here because of a polymorphism, not because of its methyl-sensitivity), and analyzed on a 4% agarose gel. The M. musculus gene is digested, the M. spretus gene does not cut, and the F1 DNA yields a product that shows 50% digestion. (Lanes 4–7) DNA from two single κ+ B cells was digested with AvaI and PCR amplified. (The secondary PCR primers were P1 and P2.) Uncut PCR products are in lanes 4 and 6; HhaI digested PCR products are in lanes 5 and 7. Cells 1 and 2 are monoallelic (M. musculus and M. spretus allele, respectively). Most κ+ B cells analyzed were monoallelic. (Lanes 8, 9) The same analysis of a single midbrain cell (cell 3). Both alleles were amplified from this cell and in most of the control cells analyzed. (c) (Lanes 1–3) Control M. musculus, M. spretus, or F1 genomic DNAs were PCR amplified by primers P7 and P9, digested with BsmAI, and analyzed on a 4% agarose gel. (Lanes 4–7) Tertiary PCR products derived from cells 1 and 2 (from b) using primers P7 and P9. The tertiary amplification signal is dependent on the germ-line-specific primary PCR (using primers P5 and P6). Uncut PCR products are in lanes 4 and 6, and corresponding BsmAI-digested PCR products are in lanes 5 and 7. Cell 1 (shown previously to have a methylated M. musculus allele) has an unrearranged M. musculus allele; cell 2 (shown previously to have a methylated M. spretus allele) has an unrearranged M. spretus allele. All together, 15 individual cells with PCR products from both regions were analyzed.
Figure 3
Figure 3
κ chain demethylation in B-cell development. (a) Schematic diagram of murine B-cell development (adapted from Nutt et al. 1997). The different developmental stages of B lymphopoiesis are shown together with their characteristic cell surface markers, which are used for classification according to Rolink et al. (1994) (top) or Hardy et al. (1991) (bottom). As the correlation between the two classification systems is not straightforward in all aspects, the reader is referred to the original literature for details. (b) DNAs from bone marrow B220+ cells at different stages of B-cell development (see the diagram) were tested for methylation by digestion with HhaI (+). B-cell DNA from Rag1−/− mice (arrested at the pro-B stage) (Mombaerts et al. 1992) and from Rag1−/− mice carrying a μ transgene (arrested at the small pre-B stage) (Spanopoulou et al. 1994) was digested by HindIII with (+) or without (−) HhaI. DNA from wild-type (wt) fraction D cells (pre-B stage, Hardy et al. 1991; Ehlich et al. 1993) was analyzed by digestion using HindIII–BglII with (+) or without (−) HhaI.
Figure 4
Figure 4
κ chain demethylation and rearrangement. (a) B220+ spleen cell DNA from wild-type (wt) mice (lanes 1,2), from mice carrying a neomycin resistance gene replacing the κ intronic enhancer [iEκT−/−] (Takeda et al. 1993) (lanes 3,4), and from mice carrying a prerearranged κ-transgene [Lκ] (Sharpe et al. 1991; Betz et al. 1994) (lanes 5,6) was digested by HindIII–BglII with (+) or without (−) HhaI. Blot hybridization was performed with probe 4 (see legend to Fig. 1) to visualize the endogenous κ genes exclusively. Both the endogenous κ alleles in iEκT−/− and Lκ mice were found to be fully methylated in non-B cells (data not shown). (b) B220+ spleen cell DNA taken from iEκT−/− mice was digested by HindIII (lane 1) with (+) or without (−) SacII (lane 2) or SacII–HhaI (lane 3) and analyzed by blot hybridization using probe 1. Note that although <50% of the κ alleles have the SacII site unmethylated (2.5 kb), all of these molecules are also unmethylated at the HhaI sites, suggesting that the demethylation is of an allelic nature.
Figure 5
Figure 5
Demethylation in a targeted prerearranged κ chain gene. (a) A map shows the Vκ3–83 targeted gene including the intronic enhancer (iEκ) and the constant region (Cκ) (Pelanda et al. 1996). Note that the rearranged construct is under the control of the same endogenous cis-acting DNA elements that normally regulate κ chain gene expression. (b) DNA from κ+ bone marrow (BM) (lanes 1,2) or spleen (lanes 3,4) cells of mice carrying a rearranged 3–83κ immunoglobulin light gene replacing one endogenous Igκ allele (κ+/3–83κi) (Pelanda et al. 1996) was digested by HindIII with (+) or without (−) HhaI and analyzed by blot hybridization using probe 1. Both the wild-type germ-line copy (2.7 kb) and the rearranged allele (3.0 kb) can be seen on the gel. The HhaI digestion products include the 2.1-kb band that is derived exclusively from the rearranged allele and the 0.8-kb band that comes from both alleles. Similar results were obtained with DNA from homozygous 3–83κi mice (data not shown).
Figure 6
Figure 6
Enhancers required for κ gene demethylation in vivo. B220+ spleen cell (>95% purity by FACS analysis) DNA from mice carrying a complete VκJκ rearranged transgene [Lκ] (lanes 1,2) or constructs individually lacking either the 3′ enhancer [Δ3′Eκ] (lanes 3,4) or the intronic enhancer [ΔEiκ] (lanes 5,6) (Betz et al. 1994) was digested by HindIII–KpnI with (+) or without (−) HhaI. The 1.3-kb HindIII–KpnI fragment and its 0.6-kb unmethylated digestion product are derived exclusively from the exogenous transgene; the 0.8-kb band is a common product of both the endogenous and transgenic copies. The accompanying map shows the various transgenes used in this experiment (Betz et al. 1994).

References

    1. Bertram S, Hufert FT, Haefelin DN, von Laer D. Detection of DNA in single cells using an automated cell deposition unit and PCR. BioTechniques. 1995;19:616–620. - PubMed
    1. Betz AG, Milstein C, Gonzalez-Fernandez A, Pannel R, Larson T, Neuberger MS. Elements regulating somatic hypermutation of an immunoglobulin κ gene: Critical role for the intron enhancer/matrix attachment region. Cell. 1994;77:239–248. - PubMed
    1. Bories J-C, Demengeot J, Davidson L, Alt FW. Gene-targeted deletion and replacement mutations of the T-cell receptor β-chain enhancer: The role of enhancer elements in controlling V(D)J recombination accessibility. Proc Natl Acad Sci. 1996;93:7871–7876. - PMC - PubMed
    1. Capone M, Watrin F, Fernex C, Horvat B, Krippl B, Wu L, Scollay R, Ferrier P. TCRβ and TCRα gene enhancers confer tissue- and stage-specificity on V(D)J recombination events. EMBO J. 1993;12:4335–4346. - PMC - PubMed
    1. Chen C, Luning Prak E, Weigert M. Editing disease-associated autoantibodies. Immunity. 1997;6:97–105. - PubMed

Publication types

Substances

LinkOut - more resources