

Annual league tables of mortality in neonatal intensive care units: longitudinal study. International Neonatal Network and the Scottish Neonatal Consultants and Nurses Collaborative Study Group
- PMID: 9641927
- PMCID: PMC28588
- DOI: 10.1136/bmj.316.7149.1931
Annual league tables of mortality in neonatal intensive care units: longitudinal study. International Neonatal Network and the Scottish Neonatal Consultants and Nurses Collaborative Study Group
Abstract
Objective: To assess whether crude league tables of mortality and league tables of risk adjusted mortality accurately reflect the performance of hospitals.
Design: Longitudinal study of mortality occurring in hospital.
Setting: 9 neonatal intensive care units in the United Kingdom.
Subjects: 2671 very low birth weight or preterm infants admitted to neonatal intensive care units between 1988 and 1994.
Main outcome measures: Crude hospital mortality and hospital mortality adjusted using the clinical risk index for babies (CRIB) score.
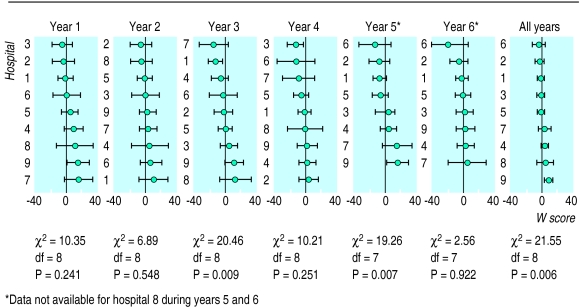
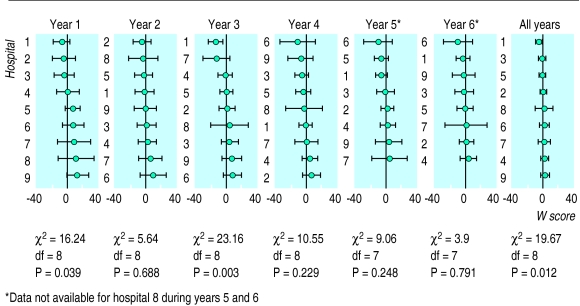
Results: Hospitals had wide and overlapping confidence intervals when ranked by mortality in annual league tables; this made it impossible to discriminate between hospitals reliably. In most years there was no significant difference between hospitals, only random variation. The apparent performance of individual hospitals fluctuated substantially from year to year.
Conclusions: Annual league tables are not reliable indicators of performance or best practice; they do not reflect consistent differences between hospitals. Any action prompted by the annual league tables would have been equally likely to have been beneficial, detrimental, or irrelevant. Mortality should be compared between groups of hospitals using specific criteria-such as differences in the volume of patients, staffing policy, training of staff, or aspects of clinical practice-after adjusting for risk. This will produce more reliable estimates with narrower confidence intervals, and more reliable and rapid conclusions.
Figures
Comment in
-
Any variability in outcome comparisons adjusted for case mix must be accounted for.BMJ. 1999 Jan 9;318(7176):128. doi: 10.1136/bmj.318.7176.128a. BMJ. 1999. PMID: 9880304 Free PMC article. No abstract available.
References
-
- Department of Health. Patient’s charter. London: HMSO; 1991.
-
- Clinical Outcomes Working Group. Clinical outcome indicators. Edinburgh: Scottish Office; 1994.
-
- Butler R. Discussion. In: Goldstein H, Spiegelhalter D. League tables and their limitations: statistical issues in comparisons of institutional performance. J R Statis Soc (A) 1996;159:409.
-
- Wise J. Clinical indicators for hospitals announced. BMJ. 1997;315:76.
Publication types
MeSH terms
Grants and funding
LinkOut - more resources
Full Text Sources
Medical