

A complex pattern of traveling stripes is produced by swimming cells of Bacillus subtilis
- PMID: 9642178
- PMCID: PMC107280
- DOI: 10.1128/JB.180.13.3285-3294.1998
A complex pattern of traveling stripes is produced by swimming cells of Bacillus subtilis
Abstract
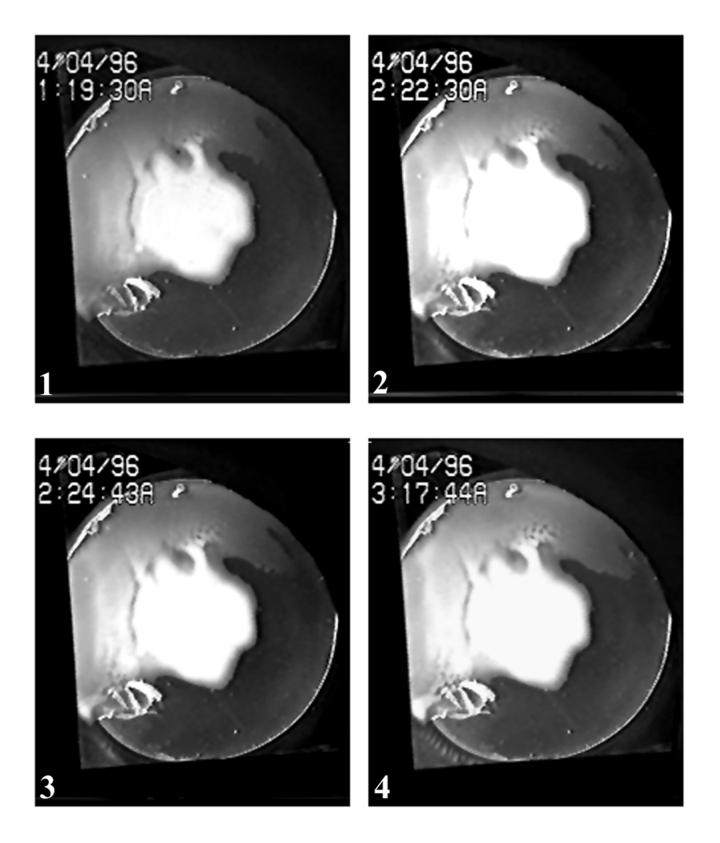
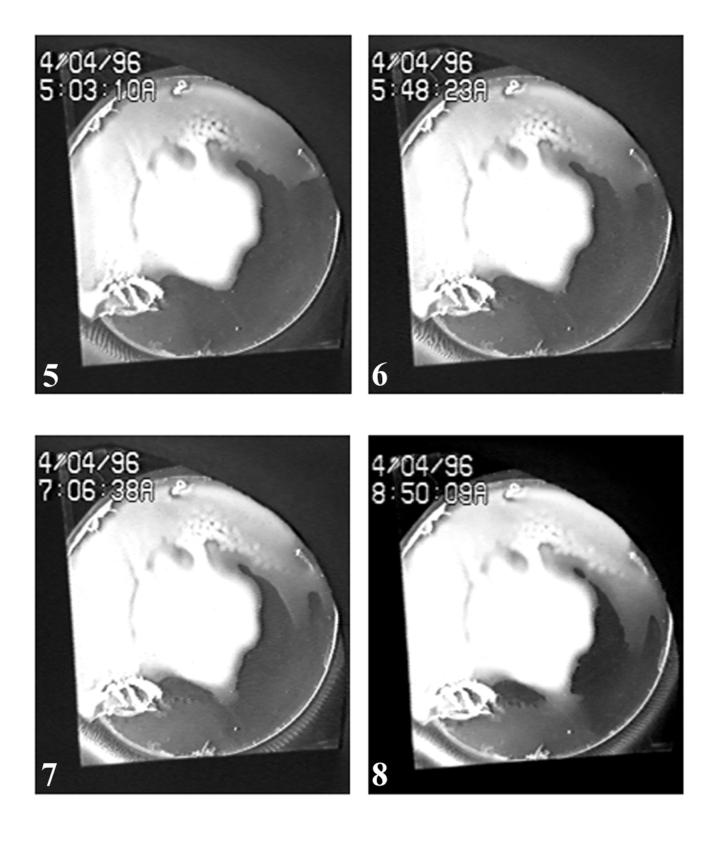
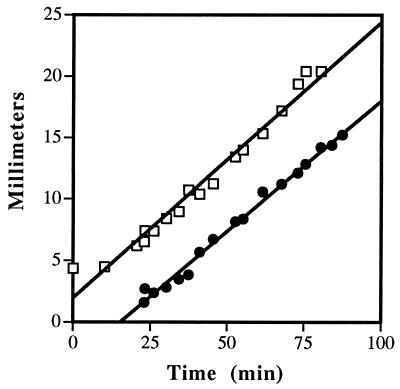
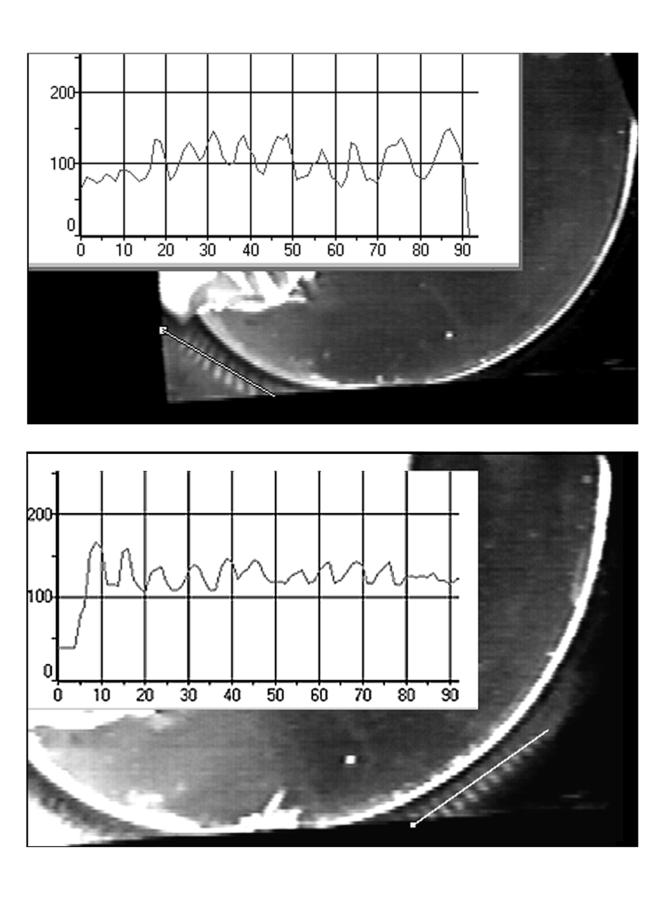
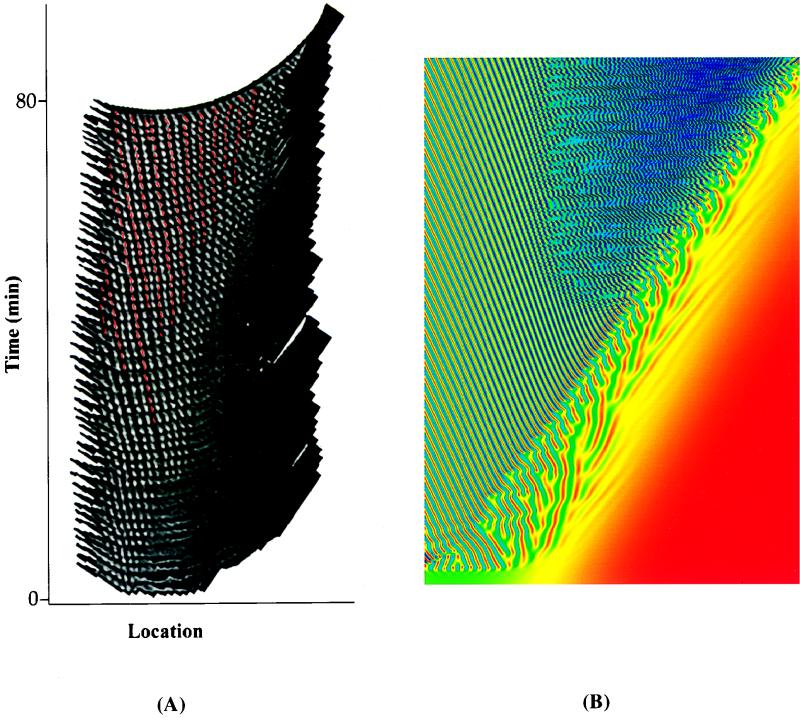
Motile cells of Bacillus subtilis inadvertently escaped from the surface of an agar disk that was surrounded by a fluid growth medium and formed a migrating population in the fluid. When viewed from above, the population appeared as a cloud advancing unidirectionally into the fresh medium. The cell population became spontaneously organized into a series of stripes in a region behind the advancing cloud front. The number of stripes increased progressively until a saturation value of stripe density per unit area was reached. New stripes arose at a fixed distance behind the cloud front and also between stripes. The spacing between stripes underwent changes with time as stripes migrated towards and away from the cloud front. The global pattern appeared to be stretched by the advancing cloud front. At a time corresponding to approximately two cell doublings after pattern formation, the pattern decayed, suggesting that there is a maximum number of cells that can be maintained within the pattern. Stripes appear to consist of high concentrations of cells organized in sinking columns that are part of a bioconvection system. Their behavior reveals an interplay between bacterial swimming, bioconvection-driven fluid motion, and cell concentration. A mathematical model that reproduces the development and dynamics of the stripe pattern has been developed.
Figures
Similar articles
-
Organized cell swimming motions in Bacillus subtilis colonies: patterns of short-lived whirls and jets.J Bacteriol. 1999 Jan;181(2):600-9. doi: 10.1128/JB.181.2.600-609.1999. J Bacteriol. 1999. PMID: 9882676 Free PMC article.
-
Swimming of bacterium Bacillus subtilis with multiple bundles of flagella.Soft Matter. 2019 Dec 11;15(48):10029-10034. doi: 10.1039/c9sm01790a. Soft Matter. 2019. PMID: 31769462
-
Fluid flows created by swimming bacteria drive self-organization in confined suspensions.Proc Natl Acad Sci U S A. 2014 Jul 8;111(27):9733-8. doi: 10.1073/pnas.1405698111. Epub 2014 Jun 23. Proc Natl Acad Sci U S A. 2014. PMID: 24958878 Free PMC article.
-
Shelter in a Swarm.J Mol Biol. 2015 Nov 20;427(23):3683-94. doi: 10.1016/j.jmb.2015.07.025. Epub 2015 Aug 12. J Mol Biol. 2015. PMID: 26277623 Free PMC article. Review.
-
Bacterial determinants of the social behavior of Bacillus subtilis.Res Microbiol. 2013 Sep;164(7):788-98. doi: 10.1016/j.resmic.2013.06.004. Epub 2013 Jun 20. Res Microbiol. 2013. PMID: 23791621 Review.
Cited by
-
Entropy Production in a System of Janus Particles.Entropy (Basel). 2025 Jan 23;27(2):112. doi: 10.3390/e27020112. Entropy (Basel). 2025. PMID: 40003109 Free PMC article.
-
Analysis and modeling of the inverted bioconvection in Chlamydomonas reinhardtii: emergence of plumes from the layer of accumulated cells.Heliyon. 2018 Mar 27;4(3):e00586. doi: 10.1016/j.heliyon.2018.e00586. eCollection 2018 Mar. Heliyon. 2018. PMID: 29862349 Free PMC article.
-
Pattern formation and traveling waves in myxobacteria: theory and modeling.Proc Natl Acad Sci U S A. 2001 Dec 18;98(26):14913-8. doi: 10.1073/pnas.221579598. Proc Natl Acad Sci U S A. 2001. PMID: 11752439 Free PMC article.
-
Phase separation and emergent structures in an active nematic fluid.Phys Rev E Stat Nonlin Soft Matter Phys. 2014 Oct;90(4):042304. doi: 10.1103/PhysRevE.90.042304. Epub 2014 Oct 8. Phys Rev E Stat Nonlin Soft Matter Phys. 2014. PMID: 25375491 Free PMC article.
References
-
- Bénard H. Les tourbillons cellulaires dans une nappe liquide transportant de la chaleur par convection en régime permanent. Ann Chim Phys. 1901;23:62–144.
-
- Budrene E O, Berg H C. Complex patterns formed by motile cells of Escherichia coli. Nature. 1991;349:630–633. - PubMed
-
- Childress S, Levandowsky M, Spiegel E A. Pattern formation in a suspension of swimming micro-organisms. J Fluid Mech. 1975;69:595–613.
-
- Cross M C, Hohenberg P C. Pattern formation outside of equilibrium. Rev Mod Phys. 1993;65:851–1112.
-
- Hill N A, Pedley T J, Kessler J O. The growth of bioconvection patterns in a suspension of gyrotactic micro-organisms in a layer of finite depth. J Fluid Mech. 1989;208:509–543. - PubMed
Publication types
MeSH terms
Substances
LinkOut - more resources
Full Text Sources
