. 1998 Jun 29;141(7):1685-95.
doi: 10.1083/jcb.141.7.1685.

Complementary roles for receptor clustering and conformational change in the adhesive and signaling functions of integrin alphaIIb beta3

Affiliations

Complementary roles for receptor clustering and conformational change in the adhesive and signaling functions of integrin alphaIIb beta3

T Hato et al. J Cell Biol. .

Abstract

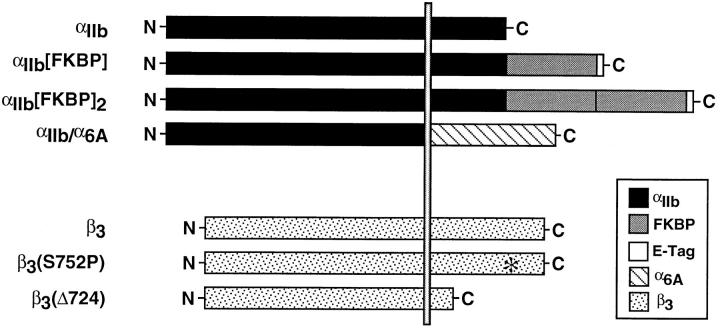
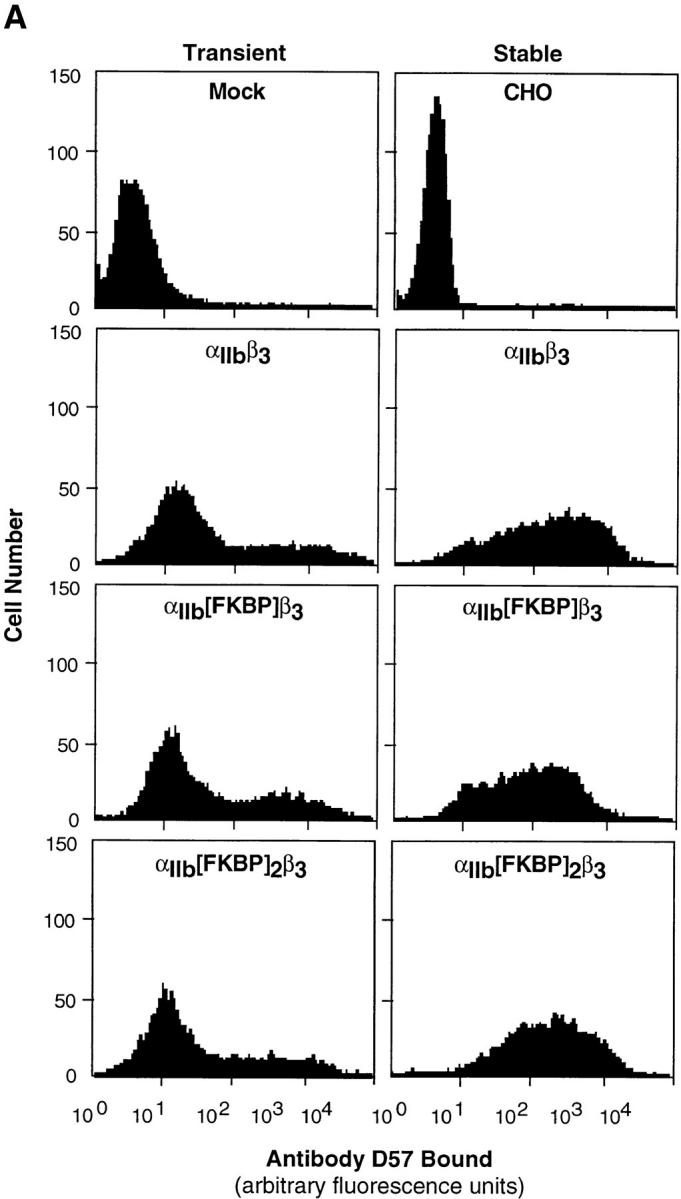
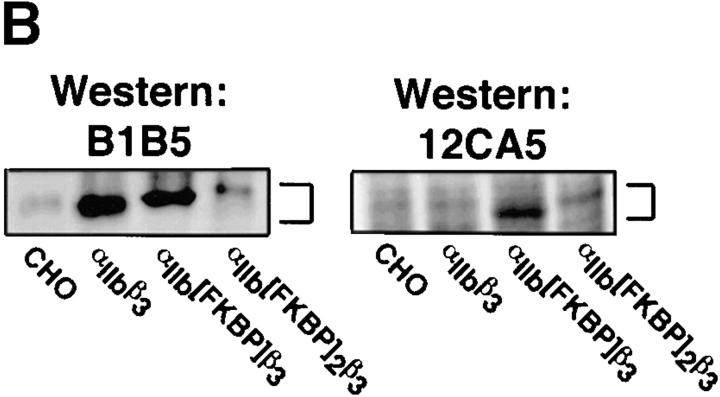
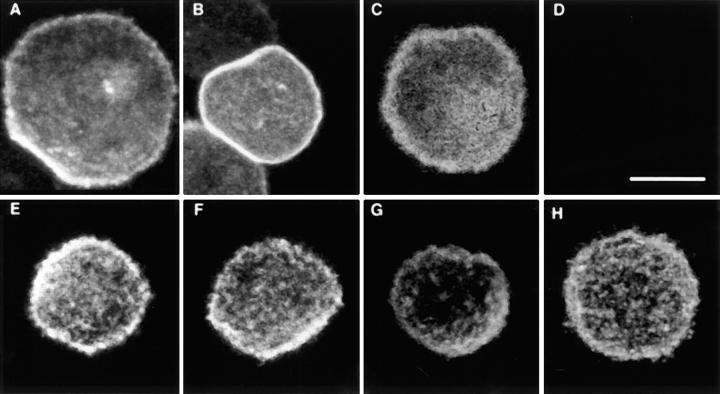
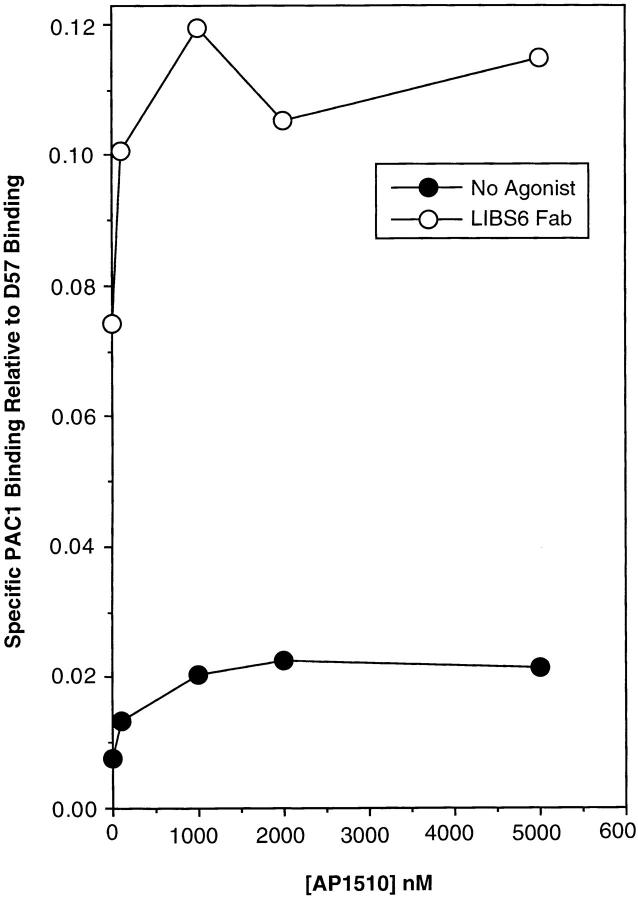
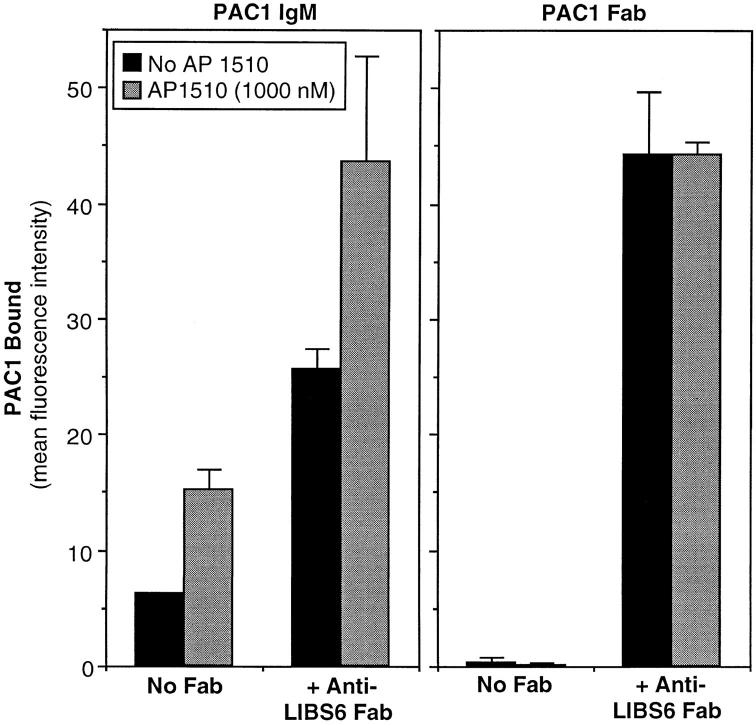
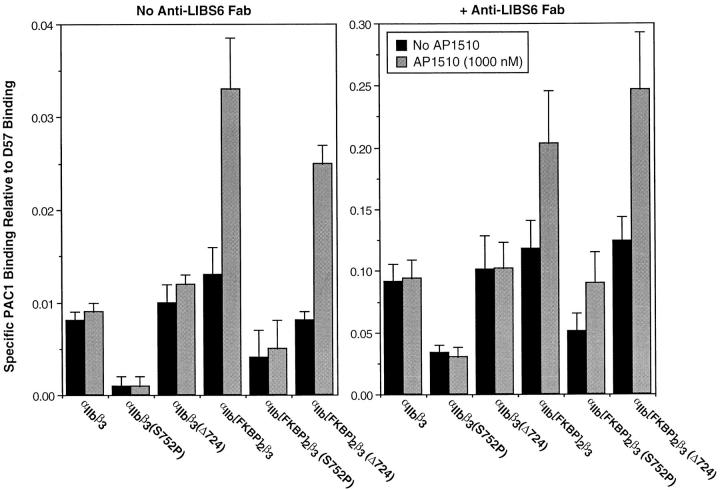
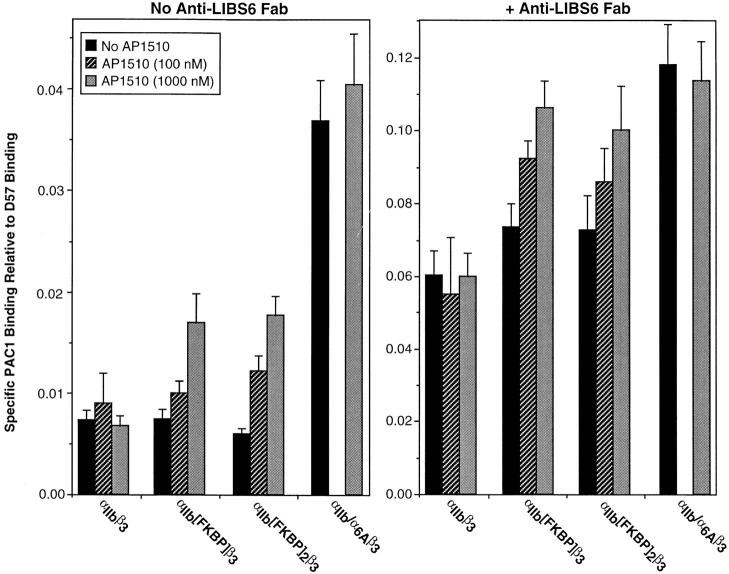
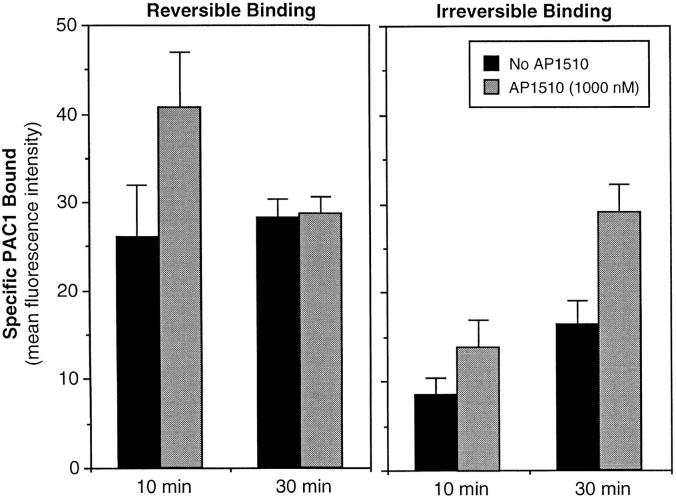
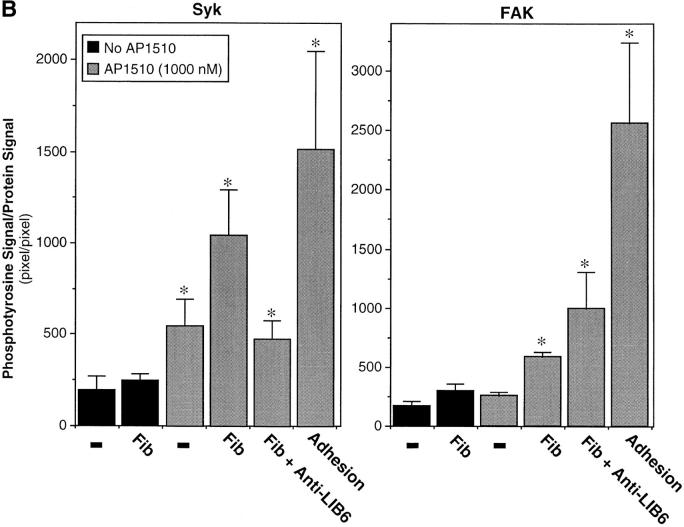
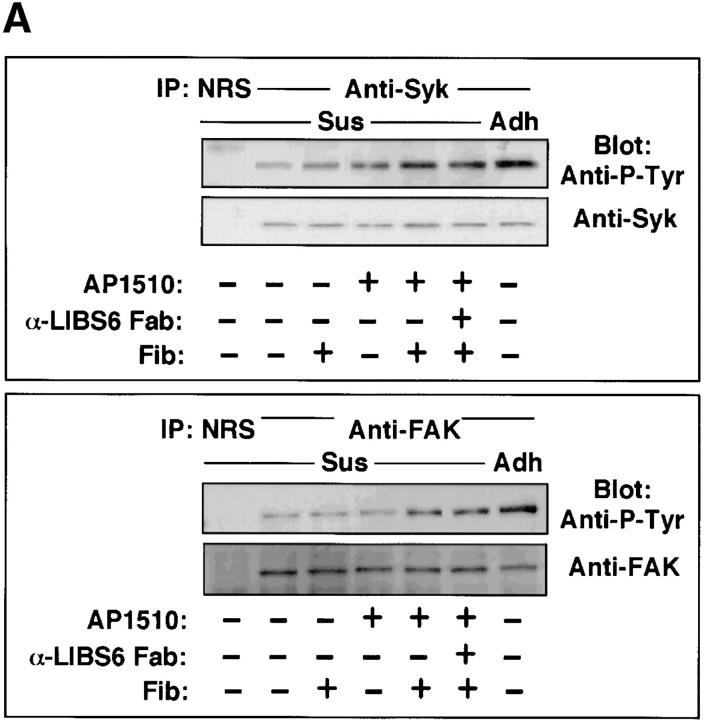
Integrin alphaIIb beta3 mediates platelet aggregation and "outside-in" signaling. It is regulated by changes in receptor conformation and affinity and/or by lateral diffusion and receptor clustering. To document the relative contributions of conformation and clustering to alphaIIb beta3 function, alphaIIb was fused at its cytoplasmic tail to one or two FKBP12 repeats (FKBP). These modified alphaIIb subunits were expressed with beta3 in CHO cells, and the heterodimers could be clustered into morphologically detectable oligomers upon addition of AP1510, a membrane-permeable, bivalent FKBP ligand. Integrin clustering by AP1510 caused binding of fibrinogen and a multivalent (but not monovalent) fibrinogen-mimetic antibody. However, ligand binding due to clustering was only 25-50% of that observed when alphaIIb beta3 affinity was increased by an activating antibody or an activating mutation. The effects of integrin clustering and affinity modulation were additive, and clustering promoted irreversible ligand binding. Clustering of alphaIIb beta3 also promoted cell adhesion to fibrinogen or von Willebrand factor, but not as effectively as affinity modulation. However, clustering was sufficient to trigger fibrinogen-independent tyrosine phosphorylation of pp72(Syk) and fibrinogen-dependent phosphorylation of pp125(FAK), even in non-adherent cells. Thus, receptor clustering and affinity modulation play complementary roles in alphaIIb beta3 function. Affinity modulation is the predominant regulator of ligand binding and cell adhesion, but clustering increases these responses further and triggers protein tyrosine phosphorylation, even in the absence of affinity modulation. Both affinity modulation and clustering may be needed for optimal function of alphaIIb beta3 in platelets.


Figures

Figure 1
Figure 1
Integrin constructs used in this study. The vertical bar represents the cell membrane. Integrin extracellular domains are to the left of the bar and intracellular domains to the right. The relative sizes of the various domains are not drawn to scale. For example, the cytoplasmic tail of αIIb contains 20 amino acid residues and a single FKBP repeat contains ∼100 residues. The asterisk in β3(S752P) marks the site of the point mutation.
Figure 2
Figure 2
Expression of αIIb(FKBP) fusion constructs with β3 in CHO cells. In A, cells were transiently or stably transfected with the indicated integrin subunits and stained with a combination of the anti-αIIbβ3 mAb, biotin-D57, and FITC-streptavidin for assessment of integrin surface expression by flow cytometry. One sample of cells was mock transfected to serve as a negative control in the transient transfections, and untransfected CHO cells served as a negative control for the stable transfectants. In B, cells were transiently transfected with the indicated integrin constructs. 48 h later, the cells were lysed with SDS sample buffer and 30 μg of protein were subjected to Western blotting with an mAb to αIIb (B1B5) or antibody 12CA5 to the hemagglutinin epitope tag located at the COOH terminus of αIIb(FKBP) and αIIb(FKBP)2. Brackets indicate the region on each blot where the different forms of αIIb are located. The very light band seen in the CHO cell lane on the B1B5 blot was neither consistent nor specific. In this particular experiment, the level of expression of αIIb(FKBP)2β3 was less than that of αIIb(FKBP)β3, accounting for the difference in band intensities between the two samples.
Figure 2
Figure 2
Expression of αIIb(FKBP) fusion constructs with β3 in CHO cells. In A, cells were transiently or stably transfected with the indicated integrin subunits and stained with a combination of the anti-αIIbβ3 mAb, biotin-D57, and FITC-streptavidin for assessment of integrin surface expression by flow cytometry. One sample of cells was mock transfected to serve as a negative control in the transient transfections, and untransfected CHO cells served as a negative control for the stable transfectants. In B, cells were transiently transfected with the indicated integrin constructs. 48 h later, the cells were lysed with SDS sample buffer and 30 μg of protein were subjected to Western blotting with an mAb to αIIb (B1B5) or antibody 12CA5 to the hemagglutinin epitope tag located at the COOH terminus of αIIb(FKBP) and αIIb(FKBP)2. Brackets indicate the region on each blot where the different forms of αIIb are located. The very light band seen in the CHO cell lane on the B1B5 blot was neither consistent nor specific. In this particular experiment, the level of expression of αIIb(FKBP)2β3 was less than that of αIIb(FKBP)β3, accounting for the difference in band intensities between the two samples.
Figure 3
Figure 3
Distribution of αIIb(FKBP)2β3 in CHO cells. CHO cells stably expressing αIIb(FKBP)2β3 were incubated in suspension for 30 min in the absence (A–D, and H) or presence (E–G) of 1,000 nM AP1510. They were then incubated at 4°C with FITC-D57 to stain the integrin (A–C, and E–G), fixed, and then deposited onto glass slides for confocal microscopy. As a negative control, cells in D were incubated only with FITC goat anti–mouse immunoglobulin. As a positive control, cells in H were incubated with unlabeled D57, followed by FITC goat anti–mouse immunoglobulin to deliberately cross-link the integrin before fixation. Panels represent single images collected from the entire series of 0.5-μm focal planes. Images are from a single experiment representative of four so performed. Bar, 10 μm.
Figure 4
Figure 4
Effect of the dimerizer, AP1510, and the activating antibody, anti–LIBS6 Fab, on PAC1 binding to CHO cells expressing αIIb(FKBP)2β3. Cells were transfected with αIIb(FKBP)2 and β3. After 48 h, they were incubated for 30 min with PAC1 along with AP1510 and/or 150 μg/ml anti-LIBS6. Then PAC1 binding to αIIb(FKBP)2β3-expressing cells was quantitated by flow cytometry as described in Materials and Methods. Specific PAC1 binding was defined as binding inhibitable by 10 μM integrilin, a selective αIIbβ3 antagonist. It was expressed relative to the amount of integrin per cell determined simultaneously with antibody D57.
Figure 5
Figure 5
Relative effects of αIIbβ3 clustering and affinity modulation on the binding of multivalent PAC1 IgM and monovalent PAC1 Fab to CHO cells. Cells stably expressing αIIb(FKBP)2β3 were incubated with a saturating concentration of PAC1 IgM (40 nM) or recombinant PAC1 Fab (30 nM) for 30 min in the absence or presence of AP1510, and specific binding of PAC1 was quantitated by flow cytometry. Unlike most other experiments, PAC1 was expressed here simply as mean fluorescence intensity in arbitrary units since correction for the degree of integrin expression was not necessary. Data represent the means ± SD of triplicate values from one experiment representative of two so performed.
Figure 6
Figure 6
Effects of β3 cytoplasmic tail mutations on PAC1 binding caused by receptor clustering and affinity modulation. CHO cells were transiently transfected with the indicated αIIb and β3 subunits. 48 h later, they were incubated for 30 min with PAC1 along with AP1510 and/or 150 μg/ml anti–LIBS6 Fab, and specific PAC1 binding was quantitated by flow cytometry. Note the almost 10-fold difference in scales of the y axes. Data represent the means ± SEM of three experiments.
Figure 7
Figure 7
Relative effects of receptor clustering and affinity modulation on PAC1 binding to αIIbβ3. CHO cells were transiently transfected with the indicated integrin constructs. 48 h later, they were incubated for 30 min with PAC1 along with AP1510 and/or 150 μg/ml anti–LIBS6 Fab, and specific PAC1 binding was quantitated by flow cytometry. Note the difference in scales of the y axes. Data represent the means ± SEM of three to five experiments.
Figure 8
Figure 8
Effect of receptor clustering on reversible and irreversible ligand binding to αIIb(FKBP)2β3. Binding of PAC1 in response to anti–LIBS6 Fab was initiated in CHO cells stably- expressing αIIb(FKBP)2β3, either in the absence or presence of AP1510. After 10 or 30 min, half of each sample was treated with 5 mM EDTA to displace reversibly bound PAC1 and half was not. Then specific PAC1 binding was determined. Reversible PAC1 binding was defined as specific binding displaced by EDTA, and irreversible binding was defined as specific binding that was not displaced by EDTA. Data represent the means ± SEM of three experiments.
Figure 9
Figure 9
Relative effects of receptor clustering and affinity modulation on CHO cell adhesion to fibrinogen or vWF. As described in Materials and Methods, CHO cells stably expressing αIIb(FKBP)2β3 were fluorescently labeled with BCECF, and then incubated for 90 min in microtiter wells coated with fibrinogen (left panel ) or vWf (right panel ) in the presence of 1,000 nM AP1510 and/or 150 μg/ml anti–LIBS6 Fab. After washing, cell adhesion was quantitated by cytofluorimetry. Adhesion was expressed as a percentage of total cells added. This experiment is representative of three so performed. Not shown is the fact that in the absence of AP1510, the adhesion of αIIb(FKBP)2β3 cells was the same as for cells expressing wild-type αIIbβ3.
Figure 10
Figure 10
Effect of integrin clustering on tyrosine phosphorylation of Syk and FAK. In A, CHO cells stably-expressing αIIb(FKBP)2β3 were transiently transfected with Syk. 48 h later, they were incubated in suspension for 10 min as indicated with 1,000 nM AP1510, 150 μg/ml anti–LIBS6 Fab, and/or 250 μg/ml fibrinogen. Lysates were prepared and immunoprecipitated with rabbit antiserum to Syk (top) or FAK (bottom), and samples were subjected to Western blotting with antibodies 4G10 and PY20 to phosphotyrosine (anti–P-Tyr). Finally, blots were stripped and reprobed with antibodies to Syk or FAK to assess gel loading. The first lane in each blot is a negative control using normal rabbit serum (NRS) for immunoprecipitation. The last lane (Adh) is a “positive control” in which cells were allowed to become adherent over 60 min to immobilized antibody D57 before lysis. In B, the data represent the means ± SEM of three such experiments. The intensities of the phosphotyrosine bands are expressed relative to the intensities of the matching Syk and FAK immunoreactive bands. Asterisks denote statistically significant differences (P ≤ 0.05) from the cells incubated in suspension without additives (black bar labeled –).
Figure 10
Figure 10
Effect of integrin clustering on tyrosine phosphorylation of Syk and FAK. In A, CHO cells stably-expressing αIIb(FKBP)2β3 were transiently transfected with Syk. 48 h later, they were incubated in suspension for 10 min as indicated with 1,000 nM AP1510, 150 μg/ml anti–LIBS6 Fab, and/or 250 μg/ml fibrinogen. Lysates were prepared and immunoprecipitated with rabbit antiserum to Syk (top) or FAK (bottom), and samples were subjected to Western blotting with antibodies 4G10 and PY20 to phosphotyrosine (anti–P-Tyr). Finally, blots were stripped and reprobed with antibodies to Syk or FAK to assess gel loading. The first lane in each blot is a negative control using normal rabbit serum (NRS) for immunoprecipitation. The last lane (Adh) is a “positive control” in which cells were allowed to become adherent over 60 min to immobilized antibody D57 before lysis. In B, the data represent the means ± SEM of three such experiments. The intensities of the phosphotyrosine bands are expressed relative to the intensities of the matching Syk and FAK immunoreactive bands. Asterisks denote statistically significant differences (P ≤ 0.05) from the cells incubated in suspension without additives (black bar labeled –).

References

    1. Abrams C, Deng J, Steiner B, Shattil SJ. Determinants of specificity of a baculovirus-expressed antibody Fab fragment that binds selectively to the activated form of integrin αIIbβ3 . J Biol Chem. 1994;269:18781–18788. - PubMed
    1. Abrams CS, Ruggeri ZM, Taub R, Hoxie JA, Nagaswami C, Weisel W, Shattil SJ. Anti-idiotypic antibodies against an antibody to the platelet glycoprotein (GP) IIb-IIIa complex mimic GP IIb-IIIa by recognizing fibrinogen. J Biol Chem. 1992;267:2775–2785. - PubMed
    1. Amara JF, Clackson T, Rivera VM, Guo T, Keenan T, Natesan S, Pollock R, Yang W, Courage NL, Holt DA, Gilman M. A versatile synthetic dimerizer for the regulation of protein–protein interactions. Proc Natl Acad Sci USA. 1997;94:10618–10623. - PMC - PubMed
    1. Banfic H, Tang XW, Batty IH, Downes CP, Chen CS, Rittenhouse SE. A novel integrin-activated pathway forms PKB/Akt-stimulatory phosphatidylinositol 3,4-bisphosphate via phosphatidylinositol 3-phosphate in platelets. J Biol Chem. 1998;273:13–16. - PubMed
    1. Bazzoni G, Hemler ME. Are changes in integrin affinity and conformation overemphasized? . Trends Biochem Sci. 1998;23:30–34. - PubMed

Publication types

Substances