. 1998 May;112(2):205-15.
doi: 10.1046/j.1365-2249.1998.00557.x.

Isolation and phenotypic characterization of colonic macrophages

Affiliations

Isolation and phenotypic characterization of colonic macrophages

G Rogler et al. Clin Exp Immunol. 1998 May.

Abstract

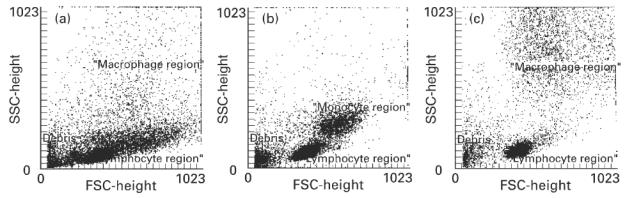
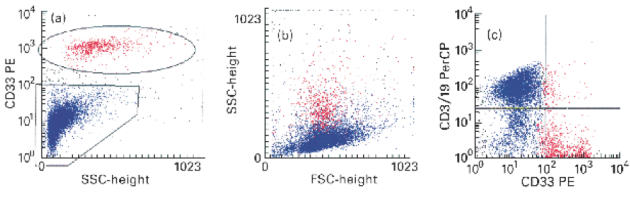
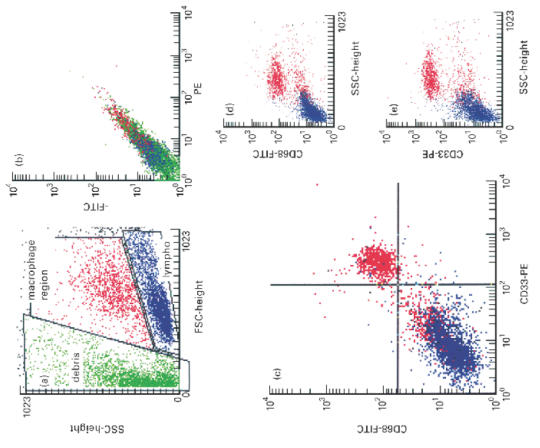
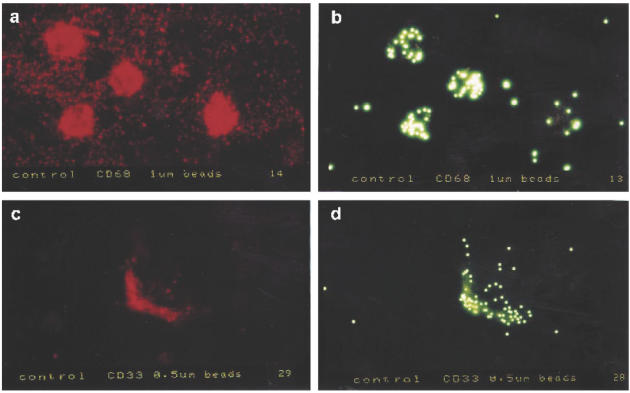
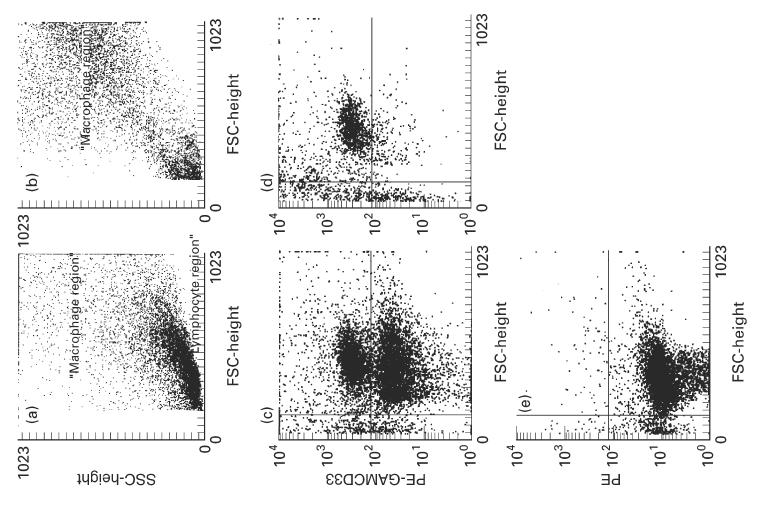
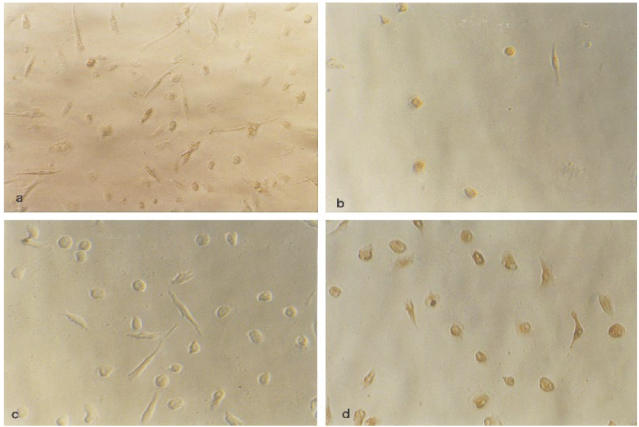
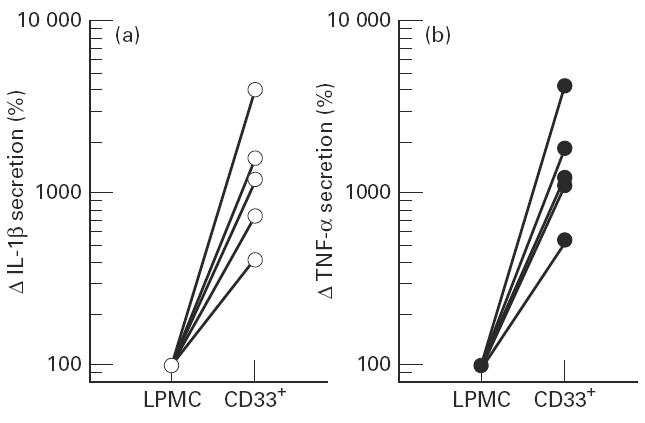
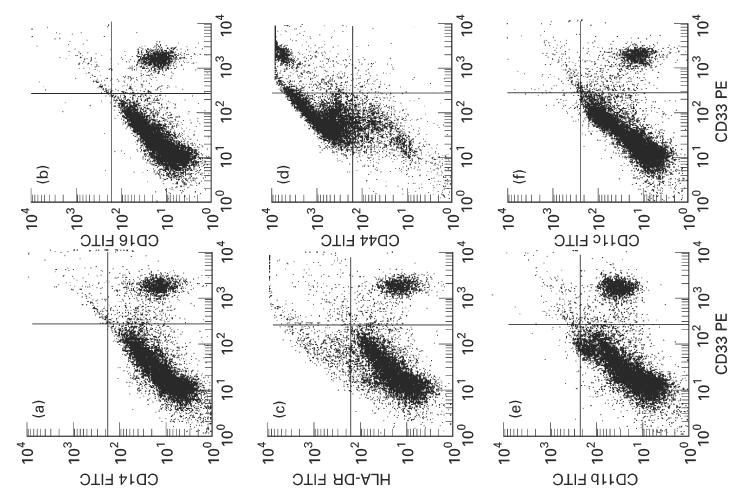
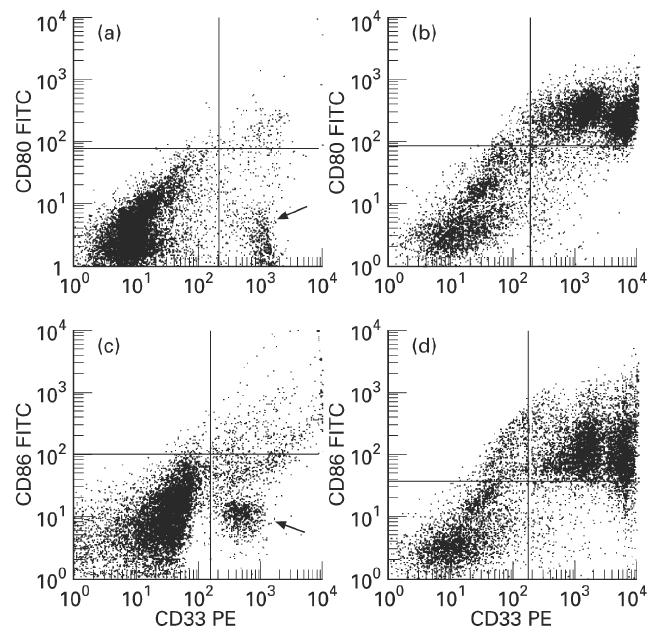
Macrophages play an important role in the intestinal mucosal immune system. However, they are a poorly defined cell population. We therefore determined their phenotype in normal colonic mucosa. Macrophages were isolated from colonic biopsies and surgical specimens by collagenase digestion. Colonic macrophages were positively sorted by anti-CD33 magnetic beads. Flow cytometric triple fluorescence analysis was applied to study CD14, CD16, CD33, CD44, CD11b, CD11c, CD64, HLA-DR, CD80, CD86 and CD3/CD19 expression. CD33 was evaluated as a positive marker for intestinal macrophages. CD33+ cells isolated from normal colonic mucosa showed co-expression of the established intracellular macrophage marker CD68 in FACS analysis. CD33+ cells were capable of phagocytosis. Isolation of this cell population by magnetic anti-CD33 beads and culture resulted in a 4.2-40-fold increase in IL-1beta and 4.5-44-fold increase in tumour necrosis factor-alpha (TNF-alpha) secretion compared with unsorted lamina propria mononuclear cells (LPMC). Of the CD33+ cells, 90.9 +/- 6.9% (mean +/- s.d.) were CD44+. However, macrophages from colonic mucosa showed only a low expression of CD14 (10.5 +/- 3.8%), CD16 (10.1 +/- 3.9%), HLA-DR (27.3 +/- 9.2%), CD11b (17.4 +/- 6.8%), CD11c (17.8 +/- 10.4%). Furthermore, expression of CD80 (9.2 +/- 4.2%) and CD86 (15.1 +/- 7.3%) was low, suggesting a low ability of normal intestinal macrophages to activate T cells and T cell-mediated immune responses. We conclude that CD33 is useful for the isolation and flow cytometric characterization of colonic macrophages. These cells exhibit a single phenotype in normal mucosa (CD33++, CD44++, CD14-, CD16-, CD11b-, CD11c-, HLA-DRlow, CD80-, CD86-) lacking lipopolysaccharide (LPS) receptor and costimulatory molecules.


Figures

Fig. 1
Fig. 1
Forward/side scatter characteristics of mononuclear cells from normal colon and from blood, and of in vitro differentiated macrophages. Isolated mononuclear cells from normal colon (a), from peripheral blood (b) or in vitro differentiated macrophages (c) were analysed by FACS (10 000 cells each). It is obvious that the discrimination between lymphocytes and monocytes/macrophages is easy for blood monocytes (b) and in vitro differentiated macrophages (c). In the case of isolated colonic macrophages (a) it is almost impossible to discriminate clearly between the lymphocyte and the macrophage region.
Fig. 2
Fig. 2
Flow cytometric detection of CD33+ cells from colonic mucosa. (a) Dot plot of side scatter characteristics versus CD33 fluorescence. Ten thousand cells were analysed each. CD33+ cells (red) are easily discriminated from the other cells (blue), which are mainly lymphocytes. (b) ‘Backgating’ of the CD33+ cells (red) shows that these cells have higher side scatter signals compared with the lymphocyte population. The region in the forward/side scatter plot is typical for monocytes/macrophages. (c) Dot plot of CD33 (PE) fluorescence versus CD3/CD19 (PerCP) fluorescence. CD33+ cells (red) are negative for the lymphocyte markers CD3 and CD19 in > 90%. Only very few cells show a positive signal for CD33 and CD3/CD19, probably due to attached or adherent cells.
Fig. 3
Fig. 3
FACS analysis of the co-expression of CD68 and CD33. (a) Forward/side scatter plot of permeabilized colonic macrophages showing an increase in debris (green). Regions were set on the macrophage (red) and lymphocyte population (blue). (b) Isotype control showing no non-specific staining. (c) Co-expression of CD68 and CD33 (upper right quadrant). The cells expressing both antigens have optical characteristics of macrophages. The red cells in the lower left quadrant indicate, again, that optical characteristics are not sufficient to distinguish clearly between colonic lymphocytes and macrophages. There are almost no cells expressing either CD33 (lower right quadrant) or CD68 (upper left quadrant) alone. (d) Side scatter versus CD68 plot showing clearly a positive cell population. (e) Side scatter versus CD33 plot showing a positive population with very similar side scatter characteristics compared with the CD68+ cells.
Fig. 4
Fig. 4
Immunofluorescence demonstration of phagocytosis in CD68+ and CD33+ cells. Human colonic mononuclear cells were isolated and immunostained as described in Materials and Methods. Specimens were obtained from patients with normal colonic histology. The staining for CD68 (a) was brighter compared with CD33 (c) with higher background staining in the cytospins, probably due to spread cytosol during centrifugation. More than 90% of the CD68+ cells (a) and > 80% of the CD33-labelled cells (c) showed phagocytosis of FITC-labelled beads (b,d).
Fig. 5
Fig. 5
Isolation of CD33+ cells by anti-CD33 magnetic beads. Forward/side scatter characteristics isolated intestinal mononuclear cells before (a) and after (b) two subsequent separation procedures with MACSbeads. The large lymphocyte population has almost completely disappeared in b. (c) Side scatter versus CD33+ cells after one isolation step. CD33+ cells are enriched to about 50% of the cells. (d) After the second separation step > 90% of the intact cells are CD33+. (e) Isotype control showing no non-specific staining.
Fig. 6
Fig. 6
Culture of isolated CD33+ colonic macrophages. CD33+ colonic macrophages isolated by magnetic beads and in vitro differentiated macrophages were cultured on Primaria six-well or 24-well plates. (a) Typical macrophage-like morphology of anti-CD33 isolated cells after 3 days of culture. Cells stained with isotype control and DAB-peroxidase. (b). Incubation with the anti-CD68 antibody. More than 90% of the cells show positive staining. The same experiments were performed with 7 day cultured in vitro differentiated macrophages (c,d). (c) Similar morphology compared with colonic macrophages, staining with isotype control antibody. (d) The CD68 antibody in parallel to the colonic macrophages stained > 90% of the in vitro differentiated macrophages.
Fig. 7
Fig. 7
IL-1β and tumour necrosis factor-alpha (TNF-α) secretion of cultured CD33+ cells. (a) IL-1β secretion of lamina propria mononuclear cells (LPMC) and sorted CD33+ cells from five different isolations. CD33+ cells secrete 4.2–40-fold more IL-1 than the LPMC. (b) TNF-α secretion after 24 h of culture in the medium of LPMC and the corresponding CD33-MACSbead-isolated colonic macrophages. Isolated CD33+ cells secreted between 4.5- and 44-fold more TNF-α.
Fig. 8
Fig. 8
Phenotype of mononuclear cells isolated from normal colonic mucosa. (a) Dot plot of CD33 (PE) fluorescence versus CD14 (FITC) fluorescence. CD33+/CD14 and CD33+/CD14+ cells are easily discriminated from the other cells. (b) Dot plot of CD33 (PE) fluorescence versus CD16 (FITC) fluorescence. (c) Dot plot of CD33 (PE) fluorescence versus HLA-DR (FITC) fluorescence. (d) Dot plot of CD33 (PE) fluorescence versus CD44 (FITC) fluorescence. (e) Dot plot of CD33 (PE) fluorescence versus CD11b (FITC) fluorescence. (f) Dot plot of CD33 (PE) fluorescence versus CD11c (FITC) fluorescence. Ten thousand cells were analysed each. There was only a low number of CD14+, CD16+, HLA-DR+, CD11b+ and CD11c+ macrophages (CD33+).
Fig. 9
Fig. 9
Expression of CD80 (B7-1) and CD86 (B7-2) on colonic macrophages and in vitro differentiated dendritic cells. (a,c) Dot plot of CD33 (PE) fluorescence versus CD80 (FITC) fluorescence (a) or versus CD86 (FITC) fluorescence (c) of colonic macrophages. Most of the population of colonic macrophages lacks CD80 and CD86 expression (arrows). Only a few cells are positive for CD80 or CD86 (upper right quadrant). (b,d) Dot plot of CD33 (PE) fluorescence versus CD80 (FITC) fluorescence (b) or versus CD86 (FITC) fluorescence (d) of in vitro differentiated dendritic cells. Almost all dendritic cells (CD33+) express CD80 and CD86 (upper right quadrants).

References

    1. Lee SH, Starkey PM, Gordon S. Quantitative analysis of total macrophage content in adult mouse tissues. Immunochemical studies with monoclonal antibody F4/80. J Exp Med. 1985;161:475–89. - PMC - PubMed
    1. Pavli P, Doe WF. Intestinal macrophages. In: MacDermott RP, Stenson WF, editors. Inflammatory bowel disease. New York: Elsevier; 1992. pp. 177–88.
    1. Donnellan WL. The structure of the colonic mucosa. The epithelium and subepithelial reticulohistiocytic complex. Gastroenterol. 1965;49:496–514. - PubMed
    1. Andus T, Rogler G, Daig R, Falk W, Schölmerich J, Gross V. Inflammatory bowel disease. In: Tygat GNJ, Bartelsman JFWM, van Deventer SJH, editors. The role of macrophages. Dordrecht: Kluwer: 1995. pp. 281–97.
    1. Grimm MC, van Pavli P, de Pol E, Doe WF. Evidence for a CD14+ population of monocytes in inflammatory bowel disease mucosa—implications for pathogenesis. Clin Exp Immunol. 1995;100:291–7. - PMC - PubMed

Publication types

MeSH terms