

Neuromodulators enhance transmitter release by two separate mechanisms at the inhibitor of crayfish opener muscle
- PMID: 9651199
- PMCID: PMC6793504
- DOI: 10.1523/JNEUROSCI.18-14-05160.1998
Neuromodulators enhance transmitter release by two separate mechanisms at the inhibitor of crayfish opener muscle
Abstract
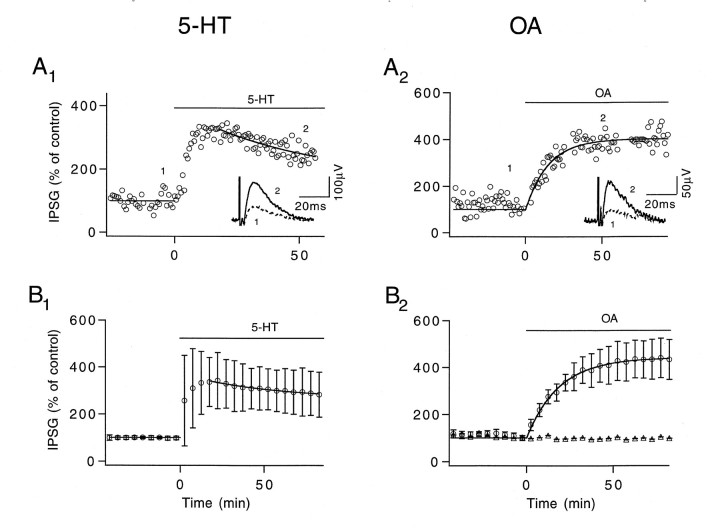
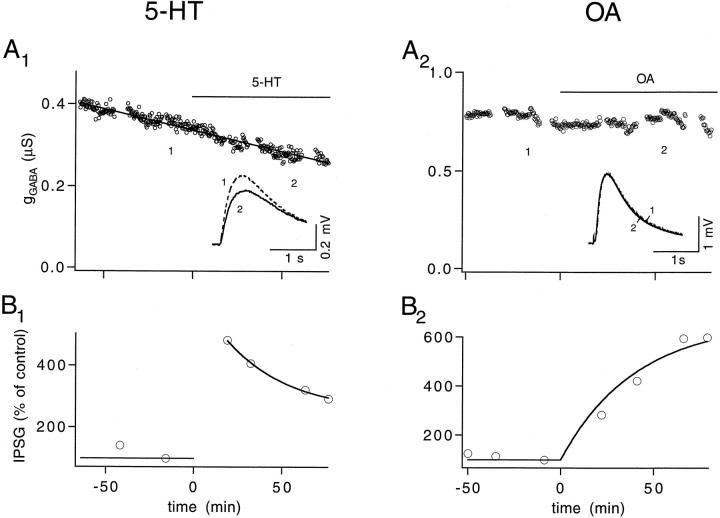
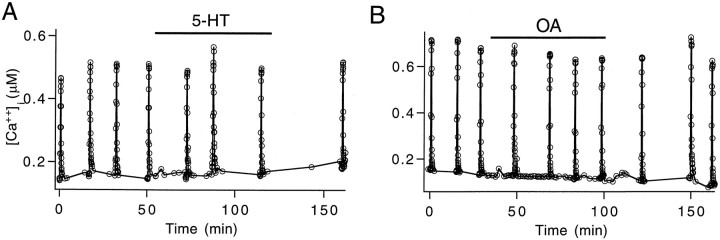
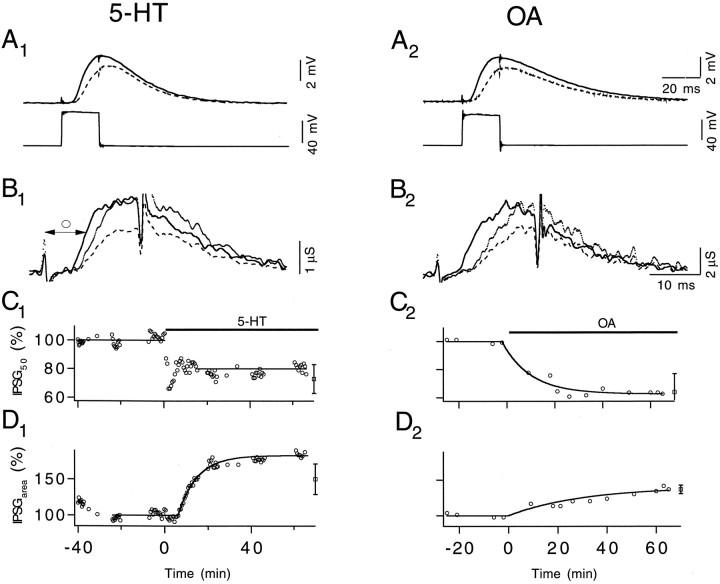
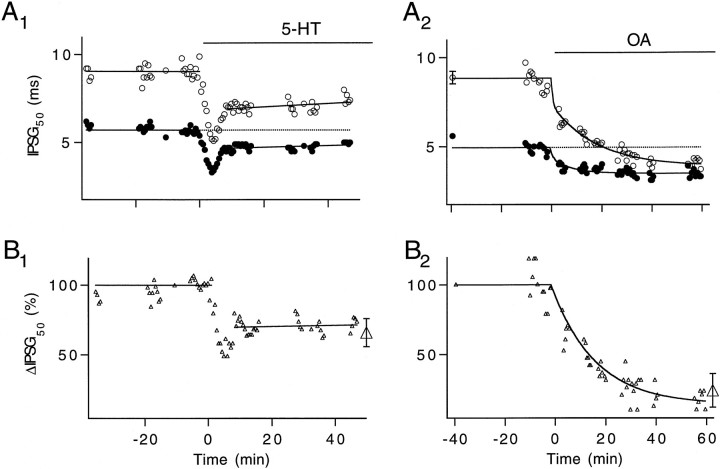
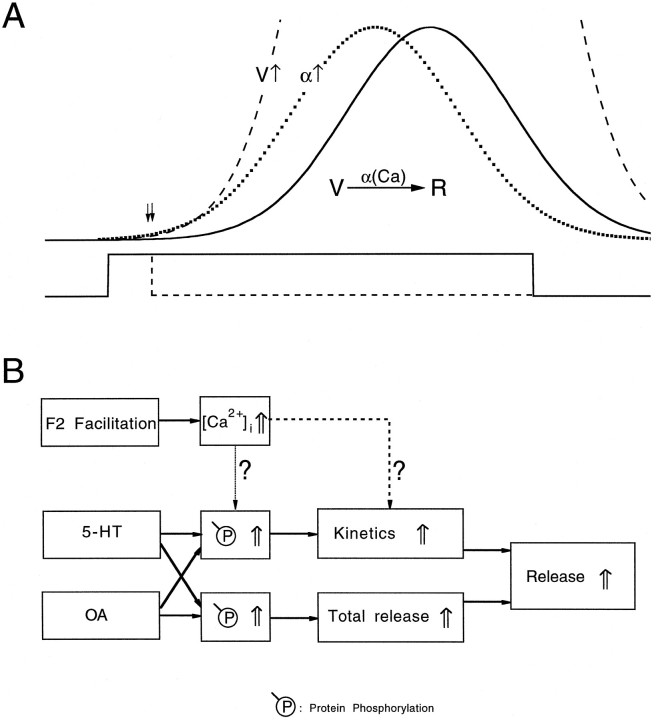
A presynaptic voltage control method has been used to investigate the modulatory effects of serotonin (5-HT) and okadaic acid (OA) on the inhibitory junction of the crayfish opener muscle. Instead of using action potentials, we used 20 msec pulses depolarized to 0 mV to activate transmitter release. This approach allowed us to monitor two separate physiological parameters related to the release process. The first parameter, transmitter release kinetics, is characterized as the delay when inhibitory postsynaptic conductance reaches its half-maximum (IPSG50). The second parameter, the total area of IPSG (IPSGarea), estimates total transmitter output. We have reported previously that the F2 component of synaptic facilitation is associated with a decrease in IPSG50 but without a change in IPSGarea. These results raised the possibility that IPSG50 and IPSGarea could be mediated by separate mechanisms that were modulated independently. To explore this possibility, we investigated the effects of 5-HT (100-200 nM) and OA (2.5 microM) on the two parameters. 5-HT and OA enhanced IPSG neither by changing the sensitivity of postsynaptic receptors, as tested by iontophoretically ejected GABA, nor by elevating resting and action potential-activated presynaptic free calcium, as monitored by fura-2 imaging. 5-HT and OA decreased IPSG50 by 3.0 +/- 1.4 and 3.6 +/- 1.1 msec, respectively, and increased IPSGarea by 50 +/- 21 and 37 +/- 6%, respectively. The ability of F2 facilitation to accelerate release kinetics was reduced in the presence of the modulators, suggesting that the mechanism underlying the accelerated release kinetics was shared by the two modes of synaptic enhancement. This report demonstrates that the acceleration in release kinetics and the increase in total release are two separate mechanisms for enhancing transmitter output and that these two mechanisms can be activated without changes in presynaptic calcium dynamics.
Figures
Similar articles
-
Modulation of available vesicles and release kinetics at the inhibitor of the crayfish neuromuscular junction.Neuroscience. 2005;130(4):889-95. doi: 10.1016/j.neuroscience.2004.10.023. Neuroscience. 2005. PMID: 15652987
-
Change of transmitter release kinetics during facilitation revealed by prolonged test pulses at the inhibitor of the crayfish opener muscle.J Neurophysiol. 1997 Oct;78(4):1791-9. doi: 10.1152/jn.1997.78.4.1791. J Neurophysiol. 1997. PMID: 9325348
-
Neuromodulation of activity-dependent synaptic enhancement at crayfish neuromuscular junction.Brain Res. 1997 Oct 17;771(2):259-70. doi: 10.1016/s0006-8993(97)00812-3. Brain Res. 1997. PMID: 9401746
-
Presynaptic calcium and serotonin-mediated enhancement of transmitter release at crayfish neuromuscular junction.J Neurosci. 1991 Sep;11(9):2631-43. doi: 10.1523/JNEUROSCI.11-09-02631.1991. J Neurosci. 1991. PMID: 1679119 Free PMC article.
-
Calcium binding sites of the transmitter release mechanism: clues from short-term facilitation.J Physiol Paris. 1995;89(3):163-6. doi: 10.1016/0928-4257(96)80114-8. J Physiol Paris. 1995. PMID: 7581306 Review.
Cited by
-
Analysis of presynaptic Ca2+ influx and transmitter release kinetics during facilitation at the inhibitor of the crayfish neuromuscular junction.J Neurosci. 2000 Sep 1;20(17):6326-32. doi: 10.1523/JNEUROSCI.20-17-06326.2000. J Neurosci. 2000. PMID: 10964937 Free PMC article.
-
Unique pharmacological properties of serotoninergic G-protein coupled receptors from cestodes.PLoS Negl Trop Dis. 2018 Feb 9;12(2):e0006267. doi: 10.1371/journal.pntd.0006267. eCollection 2018 Feb. PLoS Negl Trop Dis. 2018. PMID: 29425245 Free PMC article.
-
Serotonin and synaptic transmission at invertebrate neuromuscular junctions.Exp Neurobiol. 2012 Sep;21(3):101-12. doi: 10.5607/en.2012.21.3.101. Epub 2012 Sep 17. Exp Neurobiol. 2012. PMID: 23055788 Free PMC article.
-
Neurotoxic and synaptic effects of okadaic acid, an inhibitor of protein phosphatases.Neurochem Res. 1999 Nov;24(11):1423-30. doi: 10.1023/a:1022588808260. Neurochem Res. 1999. PMID: 10555783 Review.
-
Modulation of transmission during trains at a cerebellar synapse.J Neurosci. 2000 Feb 15;20(4):1348-57. doi: 10.1523/JNEUROSCI.20-04-01348.2000. J Neurosci. 2000. PMID: 10662825 Free PMC article.
References
-
- Atwood HL, Dixon D, Wojtowicz JM. Rapid introduction of long-term synaptic changes at crustacean neuromuscular junction. J Neurobiol. 1989;20:373–385. - PubMed
-
- Bertram R, Sherman A, Stanley EF. Single-domain/bound calcium hypothesis of transmitter release and facilitation. J Neurophysiol. 1996;75:1919–1931. - PubMed
-
- Bittner GD. Synaptic plasticity at the crayfish opener neuromuscular preparation. J Neurobiol. 1989;20:386–406. - PubMed
-
- Byers D, Davis RL, Kiger JA. Defect in cyclic AMP phosphodiesterase due to the dunce mutation of learning in Drosophila melanogaster. Nature. 1981;289:79–81. - PubMed
Publication types
MeSH terms
Substances
Grants and funding
LinkOut - more resources
Full Text Sources
Miscellaneous