. 1998 Jul 15;18(14):5240-52.
doi: 10.1523/JNEUROSCI.18-14-05240.1998.

G-Protein-dependent facilitation of neuronal alpha1A, alpha1B, and alpha1E Ca channels

Affiliations

G-Protein-dependent facilitation of neuronal alpha1A, alpha1B, and alpha1E Ca channels

U Meza et al. J Neurosci. .

Abstract

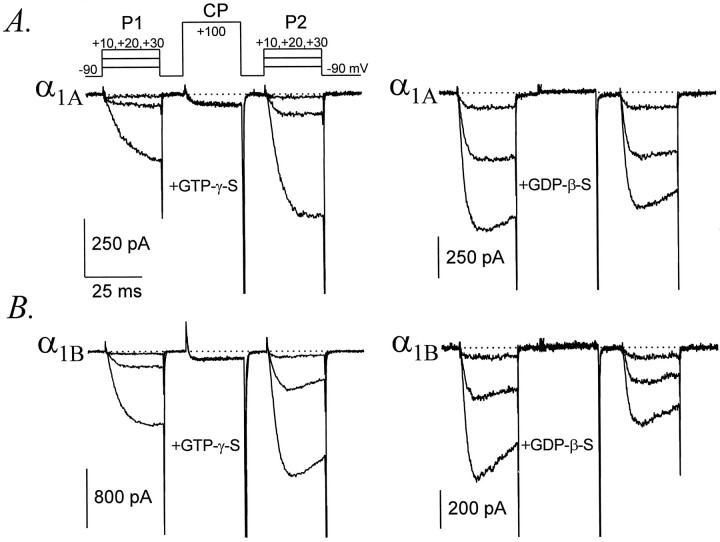
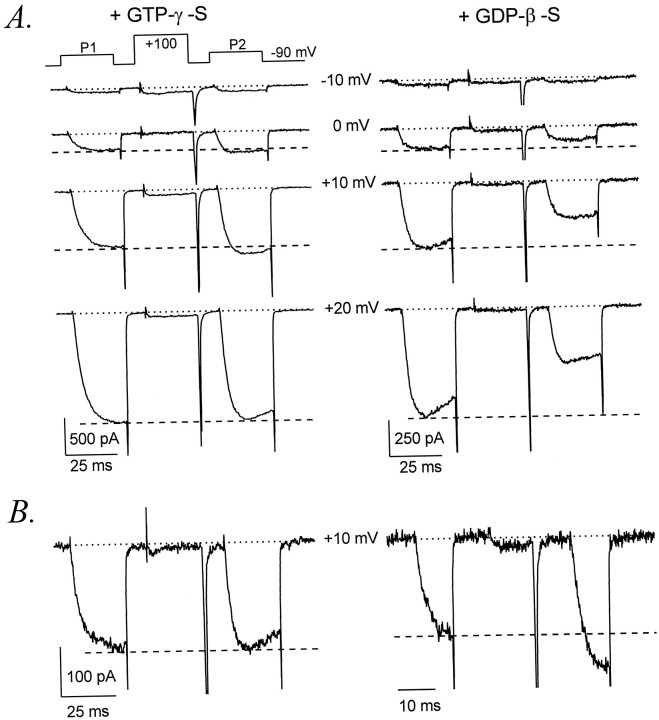
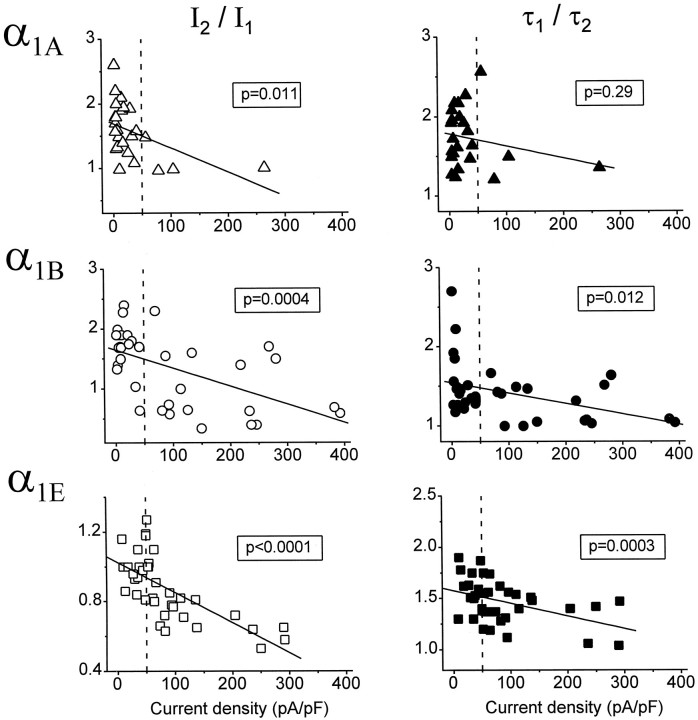
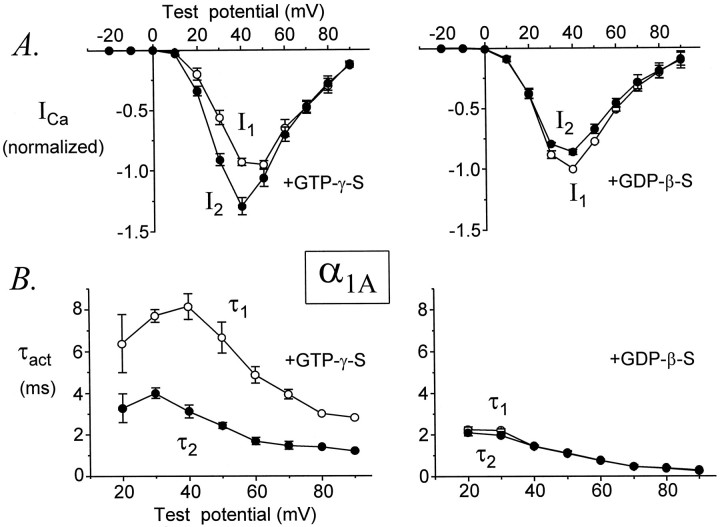
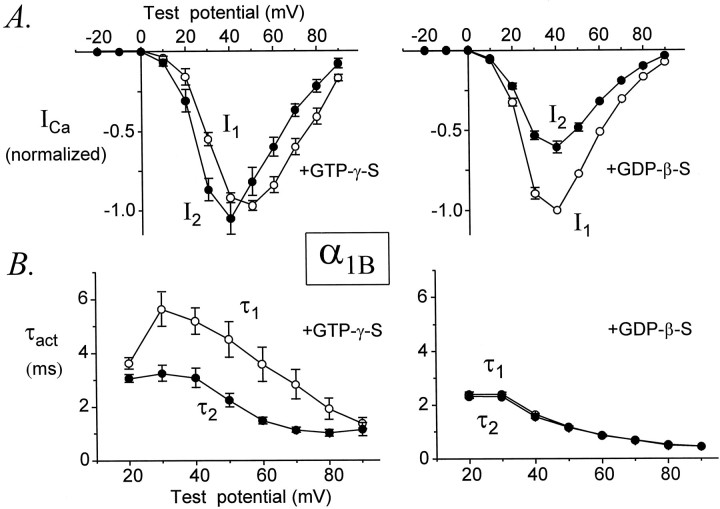
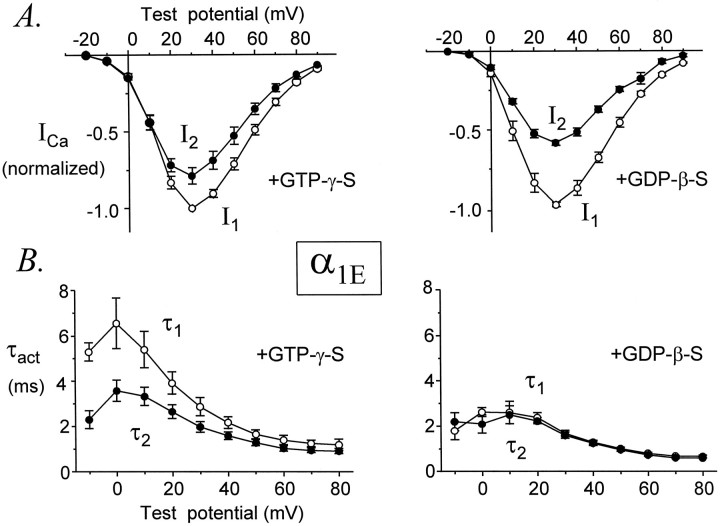
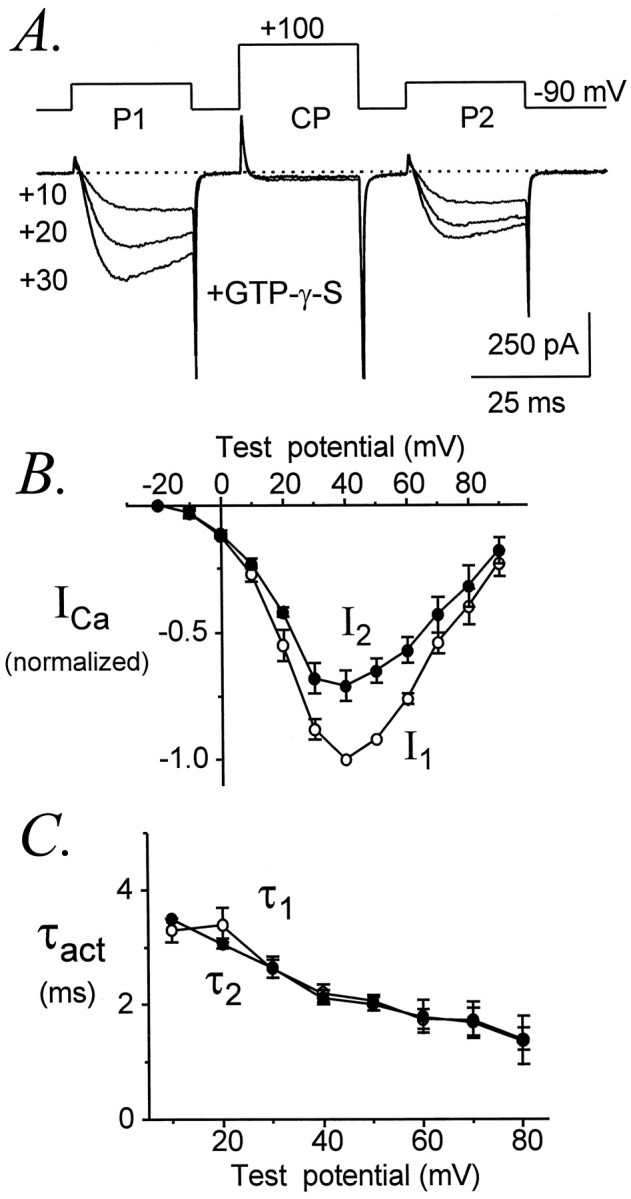
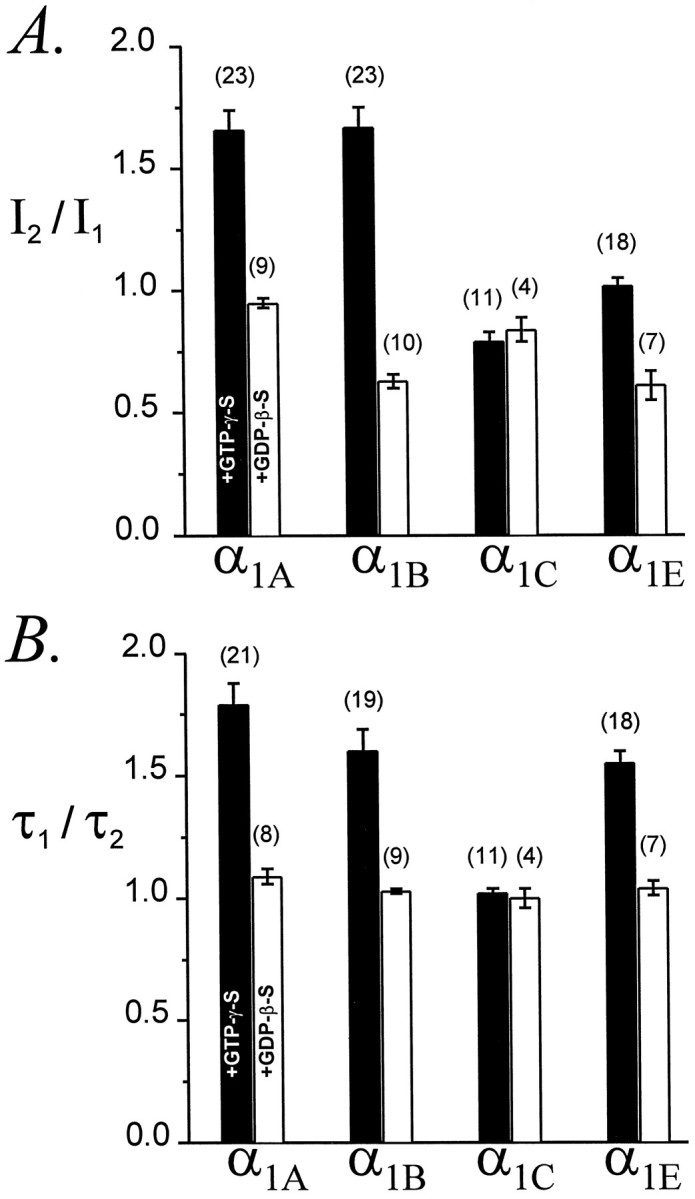
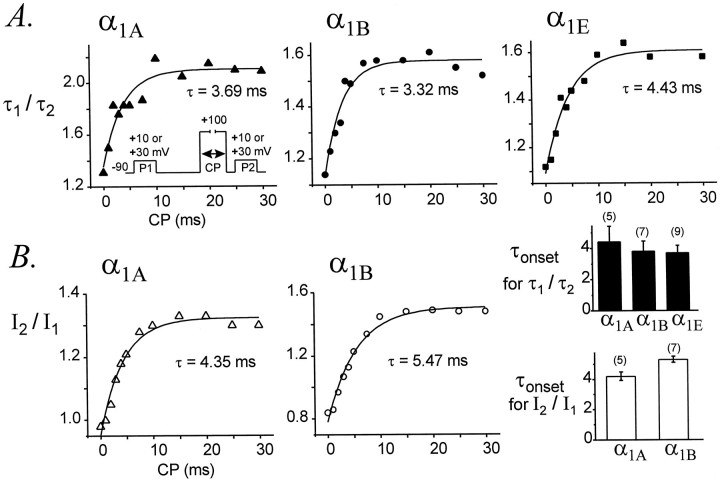
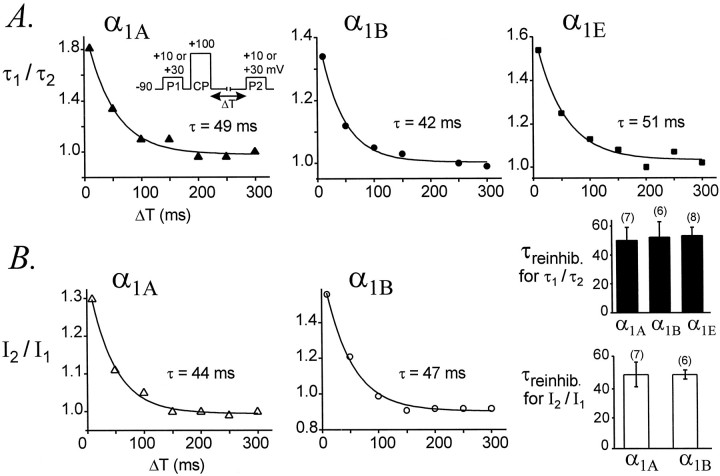
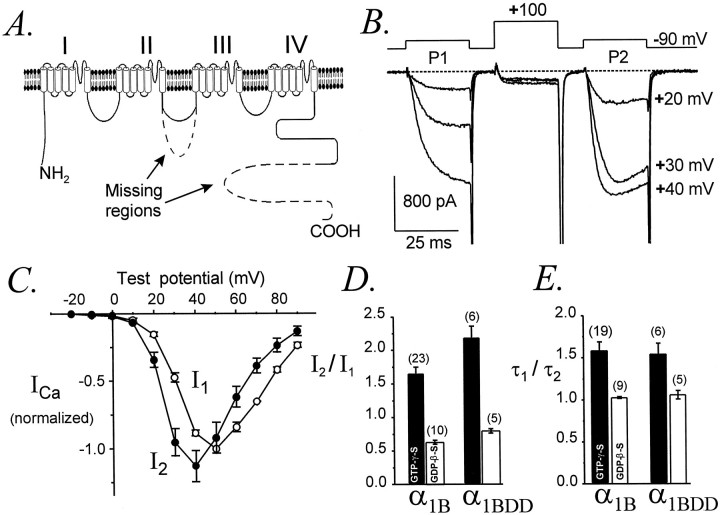
Modulation of neuronal voltage-gated Ca channels has important implications for synaptic function. To investigate the mechanisms of Ca channel modulation, we compared the G-protein-dependent facilitation of three neuronal Ca channels. alpha1A, alpha1B, or alpha1E subunits were transiently coexpressed with alpha2-deltab and beta3 subunits in HEK293 cells, and whole-cell currents were recorded. After intracellular dialysis with GTPgammaS, strongly depolarized conditioning pulses facilitated currents mediated by each Ca channel type. The magnitude of facilitation depended on current density, with low-density currents being most strongly facilitated and high-density currents often lacking facilitation. Facilitating depolarizations speeded channel activation approximately 1.7-fold for alpha1A and alpha1B and increased current amplitudes by the same proportion, demonstrating equivalent facilitation of G-protein-inhibited alpha1A and alpha1B channels. Inactivation typically obscured facilitation of alpha1E current amplitudes, but the activation kinetics of alpha1E currents showed consistent and pronounced G-protein-dependent facilitation. The onset and decay of facilitation had the same kinetics for alpha1A, alpha1B, and alpha1E, suggesting that Gbeta gamma dimers dissociate from and reassociate with these Ca channels at very similar rates. To investigate the structural basis for N-type Ca channel modulation, we expressed a mutant of alpha1B missing large segments of the II-III loop and C terminus. This deletion mutant exhibited undiminished G-protein-dependent facilitation, demonstrating that a Gbeta gamma interaction site recently identified within the C terminus of alpha1E is not required for modulation of alpha1B.


Figures

Fig. 1.
Fig. 1.
Representative whole-cell Ca currents recorded from HEK293 cells expressing α1A or α1Bchannels, illustrating G-protein-dependent facilitation. Currents were recorded after ≥5 min of intracellular dialysis with GTPγS or GDPβS, as indicated. The voltage protocol is diagrammed at top left. P1, P2, andCP were each 25 msec in duration and were separated by 10 msec intervals. A, α1A with GTPγS, data file 97425003; C = 20 pF;RS = 2.7 MΩ. α1A with GDPβS, data file 97D24008; C = 18 pF;RS = 3.2 MΩ. B, α1B with GTPγS, data file 97403026;C = 16 pF; RS = 4.8 MΩ. α1B with GDPβS, data file 97D19038;C = 23 pF; RS = 2.0 MΩ.
Fig. 2.
Fig. 2.
G-protein-dependent facilitation of α1E. A, Facilitation of α1Ecurrent amplitudes and activation kinetics in a cell dialyzed with GTPγS (left) but not in a cell dialyzed with GDPβS (right). Voltage protocol as in Figure 1.Left, Data file 98403058; C = 32 pF;RS = 2.8 MΩ. Right, Data file 97602030; C = 31 pF;RS = 2.4 MΩ. B, Facilitation of α1E is greatly enhanced by shortening the conditioning and test pulses. Left, α1Ecurrents evoked by the standard voltage protocol in which P1, P2, and CP were each 25 msec in duration. Data file 98406202;C = 17 pF; RS = 3.5 MΩ. Right, α1E currents evoked in the same cell by a briefer protocol to the same voltages but with P1 and P2 reduced to 10 msec and CP reduced to 12 msec in duration. Data file 98406204; C = 17 pF; RS= 3.5 MΩ.
Fig. 3.
Fig. 3.
The magnitude of facilitation is negatively correlated with current density. The ratioI2/I1(left panels) or τ12 (right panels) is plotted as a function of maximal Ca current density for cells expressing α1A (n = 26), α1B (n = 35), or α1E(n = 37). I1 andI2 are the amplitudes measured at the time of peak inward Ca current evoked by P1 and P2, respectively, of the standard voltage protocol (Fig. 1). P1 and P2 were to +30 mV (for α1A and α1B) or +10 mV (for α1E); facilitation was maximal at these voltages (Figs. 4-6). The pipette solution contained GTPγS. For the plots shown, current densities were determined within 60 sec of establishing the whole-cell configuration, and facilitation was calculated for currents recorded after ≥5 min of whole-cell dialysis. Thelines are linear regressions; the p value listed in each plot indicates the statistical significance of the correlation coefficient. When current densities determined after >5 min of whole-cell dialysis were used as the independent variable, thep values were 0.0008, 0.0001, and 0.0003 forI2/I1ratios and 0.27, 0.012, and 0.036 for τ12 ratios of α1A, α1B, and α1E, respectively. All subsequent comparisons of α1A, α1B, and α1E used only currents having initial densities of ≤50 pA/pF (dashed vertical line).
Fig. 4.
Fig. 4.
Voltage dependence of facilitation for α1A. A, Current–voltage relationships with GTPγS or GDPβS in the pipette solution.I1 and I2 were normalized to the maximal I1 recorded in each cell and then averaged. B, Average values of τ1 and τ2; the time constants for activation of I1 andI2, respectively, are plotted as a function of test potential. Data are from seven (GTPγS) and four (GDPβS) cells. Voltage protocol as in Figure 1.
Fig. 5.
Fig. 5.
Voltage dependence of facilitation for α1B. Data from six (GTPγS) and four (GDPβS) cells. Legend otherwise as in Figure 4.
Fig. 6.
Fig. 6.
Voltage dependence of facilitation for α1E. Data from eight (GTPγS) and six (GDPβS) cells. Legend otherwise as in Figure 4.
Fig. 7.
Fig. 7.
Absence of G-protein-dependent facilitation of α1C. A, Representative α1Ccurrents recorded from a cell dialyzed with GTPγS. Data file 97512011; C = 12 pF; RS= 3.5 MΩ. B, Average voltage dependence ofI1 and I2; data from three cells dialyzed with GTPγS.I1 and I2 were normalized by the maximal I1 in each cell.C, Average voltage dependence of τ1 and τ2; data from three cells dialyzed with GTPγS. Voltage protocol as in Figure 1.
Fig. 8.
Fig. 8.
Comparative facilitation of α1A, α1B, α1C, and α1E Ca channels.A, AverageI2/I1ratios for currents recorded with GTPγS (filled bars) or GDPβS (unfilled bars) in the pipette. Voltage protocol as in Figure 1. P1 and P2 were to +30 mV (α1A, α1B, and α1C) or +10 mV (α1E).B, Average τ12ratios for the same currents. In cells dialysed with GTPγS, the maximal current densities were 16 ± 3 pA/pF (n = 23) for α1A, 15 ± 3 pA/pF (n = 23) for α1B, 16 ± 5 pA/pF (n = 11) for α1C, and 36 ± 4 pA/pF (n= 18) for α1E. In cells dialysed with GDPβS, the maximal current densities were 20 ± 4 pA/pF (n = 9) for α1A, 12 ± 4 pA/pF (n = 10) for α1B, 6 ± 1 pA/pF (n = 4) for α1C, and 28 ± 7 pA/pF (n = 7) for α1E.
Fig. 9.
Fig. 9.
Facilitation develops with similar time course for α1A, α1B, and α1E channels. τ12ratios (A) andI2/I1ratios (B) are plotted as a function of the conditioning pulse (CP) duration for representative cells. Plots were fit by single exponential functions to yield time constants for the onset of facilitation (τonset). Average values of τonset determined using τ12 orI2/I1ratios are summarized graphically in the bottom right corner. The pipette solution contained GTPγS. α1A, Data file 98115076; C = 29 pF; RS = 2.4 MΩ. α1B, Data file 98129067; C = 27 pF; RS = 3.8 MΩ. α1E, Data file 98205005; C = 19 pF; RS = 3.2 MΩ. Data from cells expressing maximal current densities of 28 ± 5 pA/pF (α1A, n = 5), 21 ± 6 pA/pF (α1B, n = 7), and 38 ± 4 pA/pF (α1E,n = 9). Voltage protocol as in Figure 1, except that P1 and CP were separated by 50 msec at −90 mV. Each point is the average of two currents.
Fig. 10.
Fig. 10.
Facilitation decays from α1A, α1B, and α1E Ca channels at the same rate. τ12 ratios (A) andI2/I1ratios (B) are plotted as a function of ΔT, the variable interval between CP and P2 for representative cells. Each plot was fit by a single exponential function to yield a time constant for reinhibition (τreinhib). Average values of τreinhib are summarized in the bar graphs (bottom right). The pipette solution contained GTPγS. α1A, Data file 97731092; C = 24 pF; RS = 2.9 MΩ. α1B, Data file 97729010; C = 21 pF; RS = 3.0 MΩ. α1E, Data file 97D24046; C = 16 pF; RS = 3.7 MΩ. Data from cells expressing maximal current densities of 16 ± 4 pA/pF (α1A, n = 7), 23 ± 6 pA/pF (α1B, n = 6), and 39 ± 6 pA/pF (α1E, n = 8).
Fig. 11.
Fig. 11.
Undiminished G-protein-dependent modulation of α1B-DD. A, Diagrammatic representation of the mutant N-type Ca channel α1B-DD, which lacks amino acids 829–995 from the II–III loop and amino acids 1877–2338 from the C terminus. The deleted regions are indicated by dashed lines. B, Facilitation of α1B-DDcurrents, evoked using the standard voltage protocol. Data file 97321108; C = 43 pF; RS= 3.9 MΩ. C, Voltage dependence of inhibited (I1) and facilitated (I2) currents mediated by α1B-DD. I1 andI2 were normalized to the maximalI1 in each cell (n = 4). The standard voltage protocol was used. D, Facilitation of α1B-DD current amplitudes is slightly larger than for wild-type α1B. Standard voltage protocol, with P1 and P2 to +30 mV. The pipette contained GTPγS (filled bars) or GDPβS (unfilled bars).E, Facilitation of activation kinetics is identical for α1B-DD and α1B. With intracellular GTPγS, τ12 ratios were 1.60 ± 0.09 (n = 21) for α1B and 1.56 ± 0.11 (n = 6) for α1B-DD(p = 0.91). With intracellular GDPβS, τ12 ratios were 1.03 ± 0.01 (n = 5) for α1B and 1.06 ± 0.05 (n = 5) for α1B-DD(p = 0.41). D,E, Data from cells with maximal current densities of 15 ± 3 pA/pF (α1B,n = 23) and 18 ± 6 pA/pF (α1B-DD, n = 6) in the GTPγS experiments and 11 ± 5 pA/pF (α1B,n = 5) and 6 ± 1 pA/pF (α1B-DD, n = 5) in the GDPβS experiments.

Similar articles

Cited by

References

    1. Adams BA, Mori Y, Kim MS, Tanabe T, Beam KG. Heterologous expression of BI Ca2+ channels in dysgenic skeletal muscle. J Gen Physiol. 1994;104:985–996. - PMC - PubMed
    1. Adams BA, Tanabe T, Beam KG. Ca2+ current activation rate correlates with α1 subunit density. Biophys J. 1996;71:156–162. - PMC - PubMed
    1. Bean BP. Neurotransmitter inhibition of neuronal calcium currents by changes in channel voltage dependence. Nature. 1989;340:153–156. - PubMed
    1. Bernheim L, Beech DJ, Hille B. A diffusible second messenger mediates one of the pathways coupling receptors to calcium channels in rat sympathetic neurons. Neuron. 1991;6:859–867. - PubMed
    1. Bourinet E, Charnet P, Tomlinson WJ, Stea A, Snutch TP, Nargeot J. Voltage-dependent facilitation of a neuronal α1C L-type calcium channel. EMBO J. 1994;13:5032–5039. - PMC - PubMed

Publication types

LinkOut - more resources