. 1998 Jul 6;188(1):71-82.
doi: 10.1084/jem.188.1.71.

Conserved T cell receptor repertoire in primary and memory CD8 T cell responses to an acute viral infection

Affiliations

Conserved T cell receptor repertoire in primary and memory CD8 T cell responses to an acute viral infection

D J Sourdive et al. J Exp Med. .

Abstract

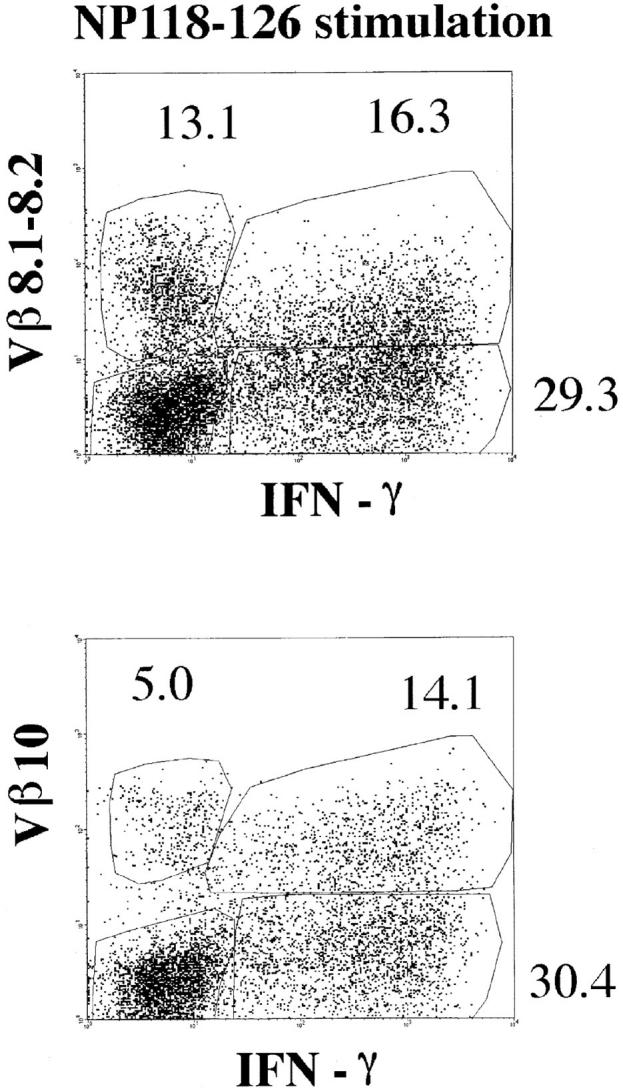
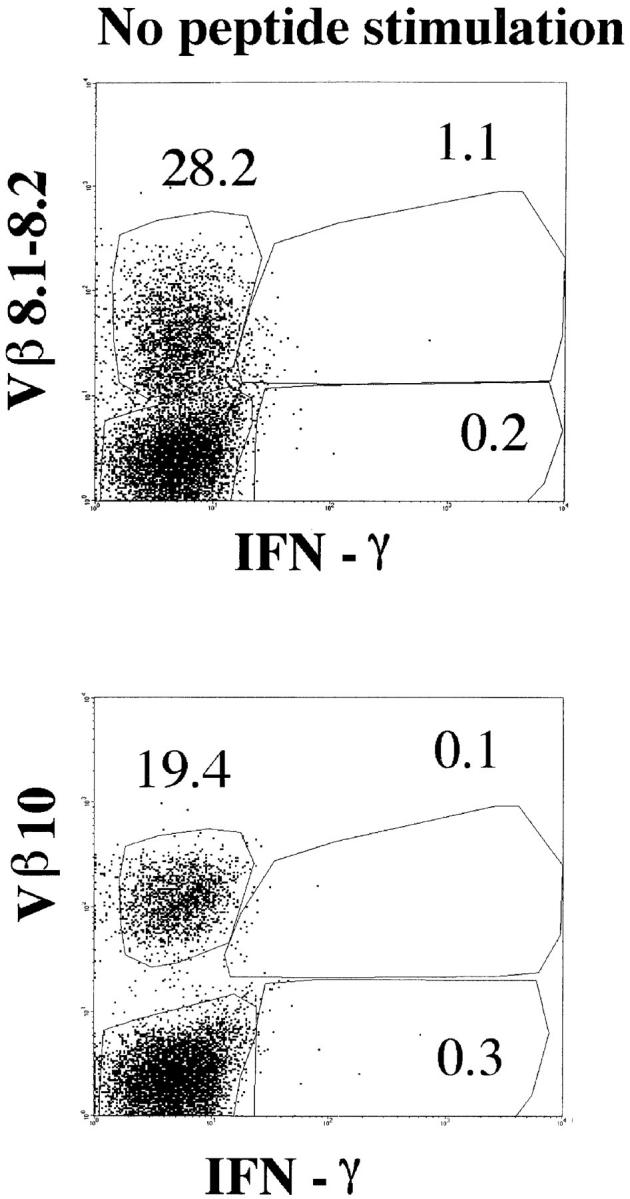
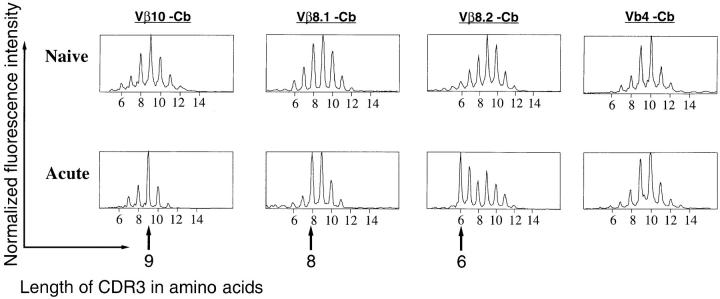
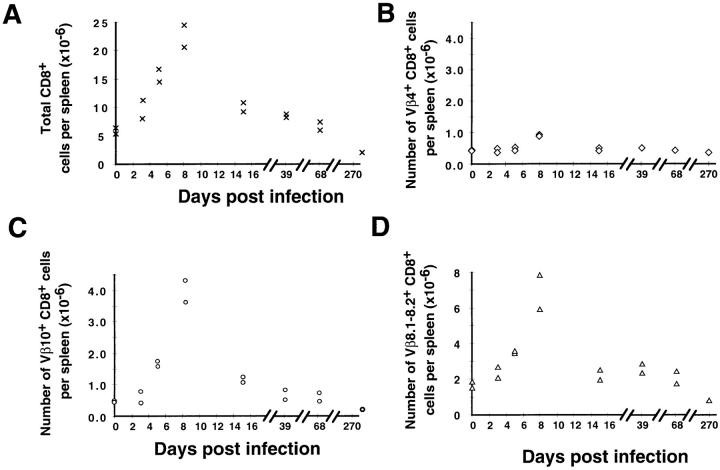
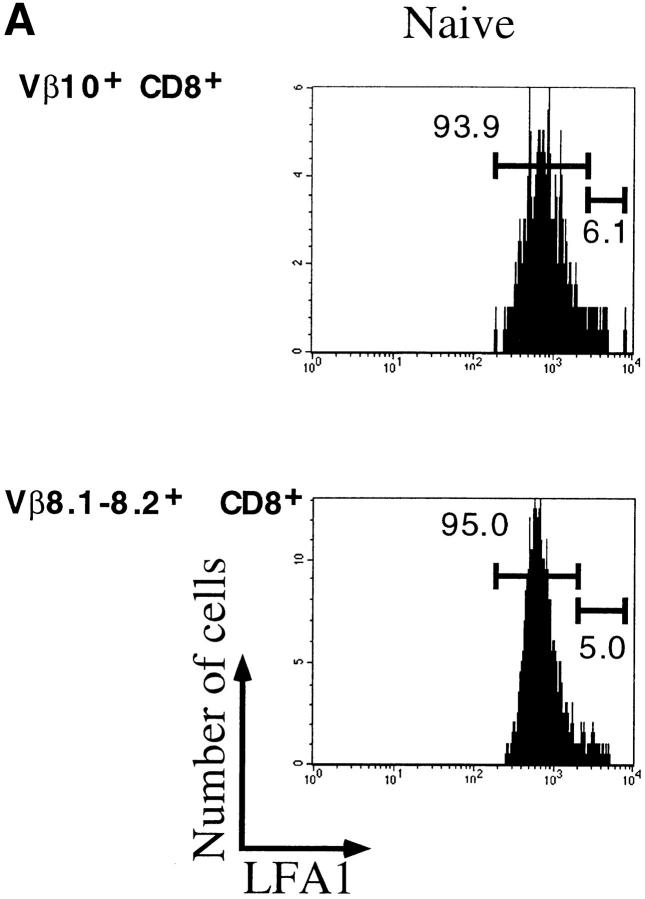
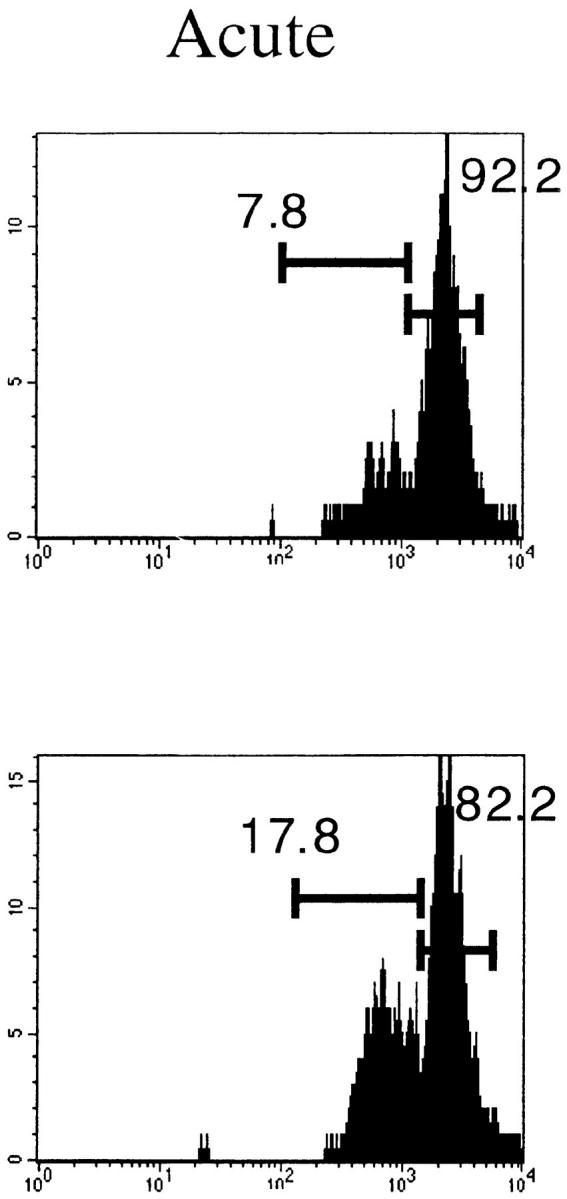
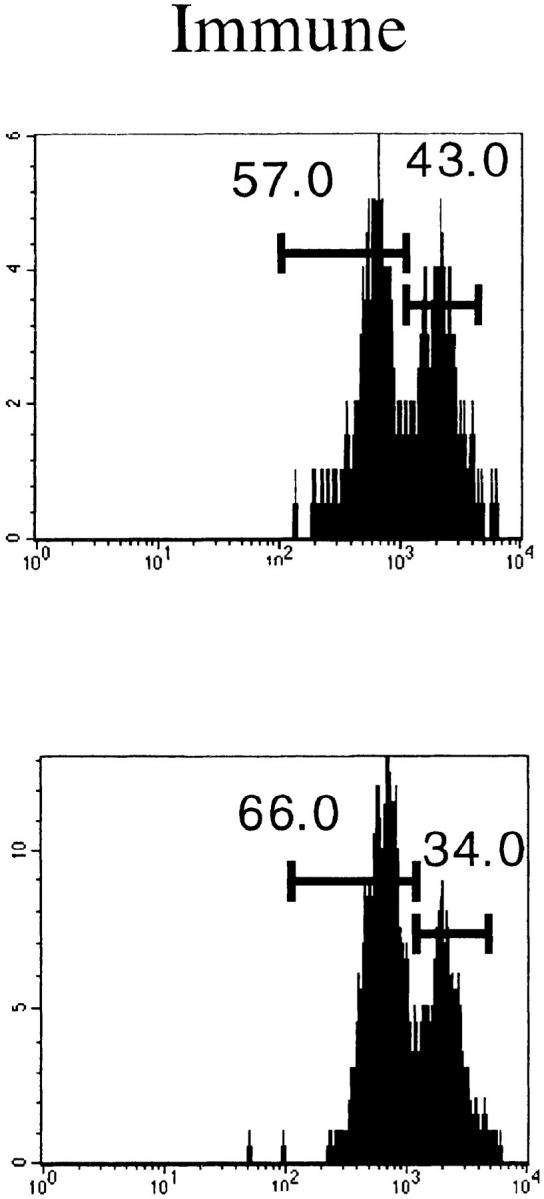
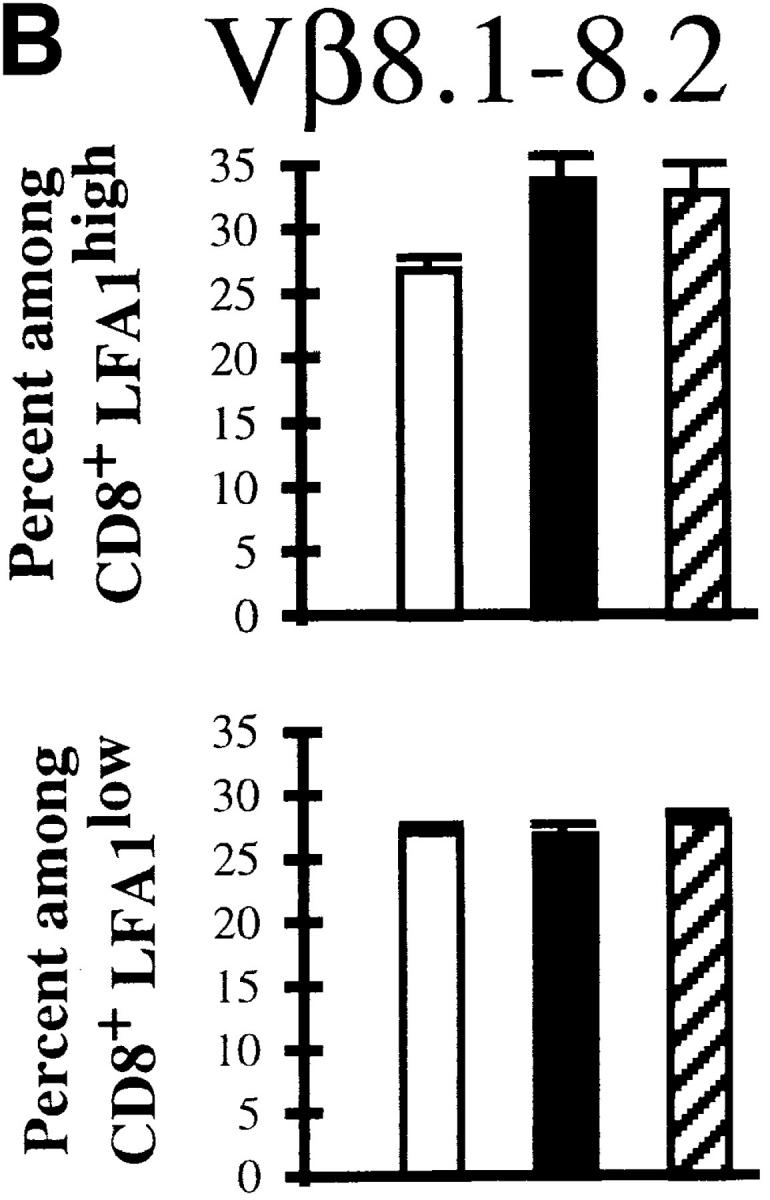
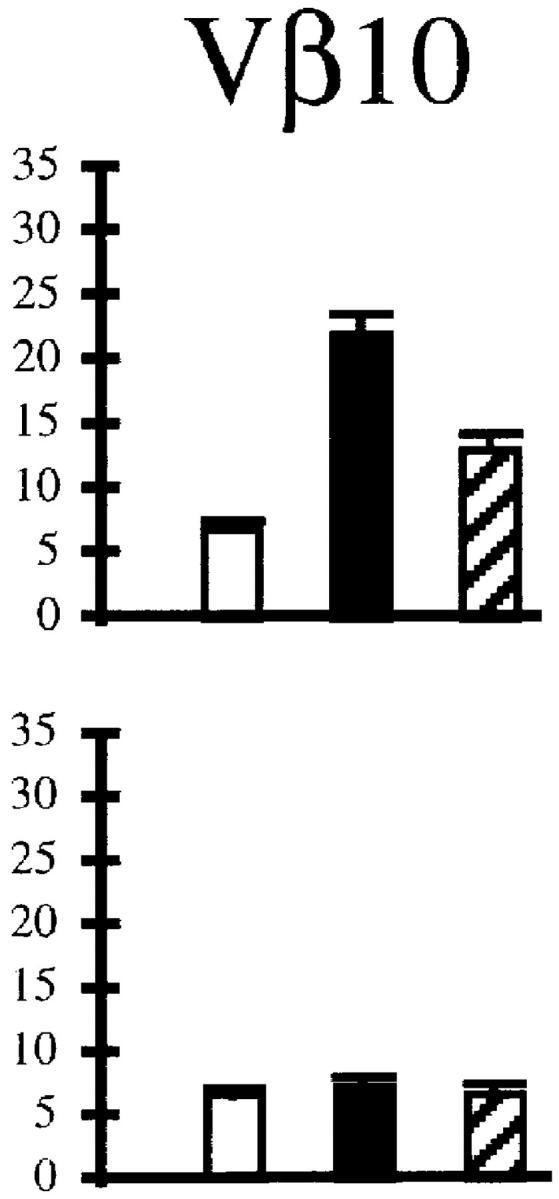
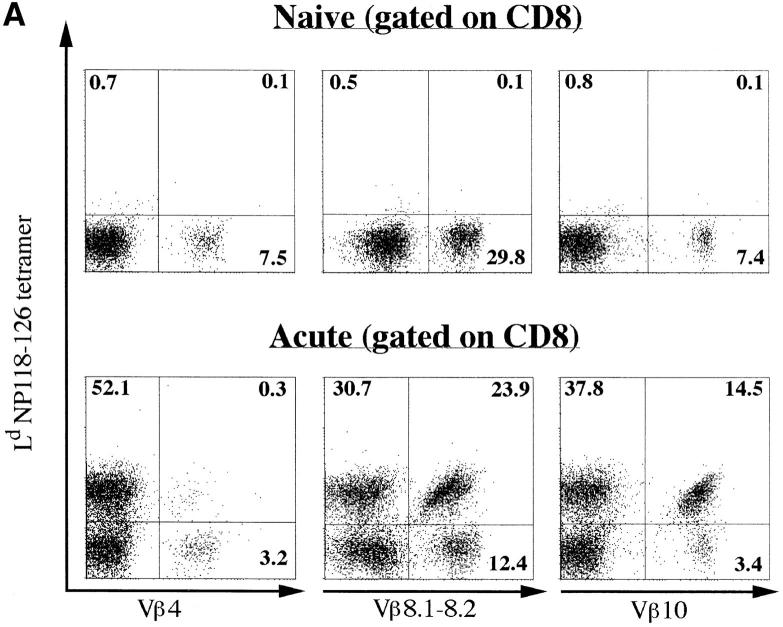
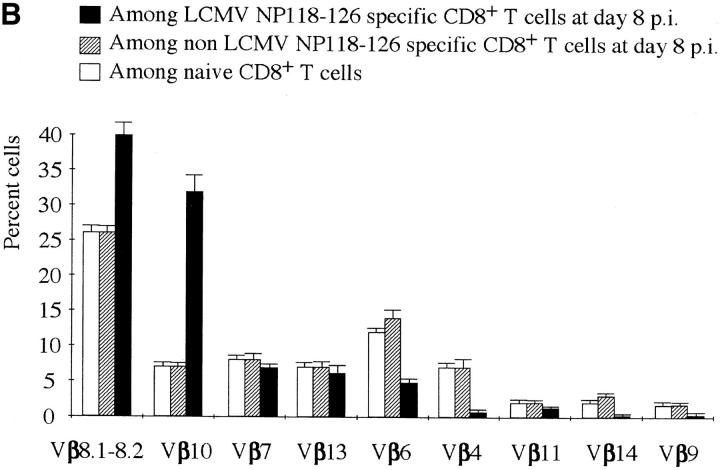
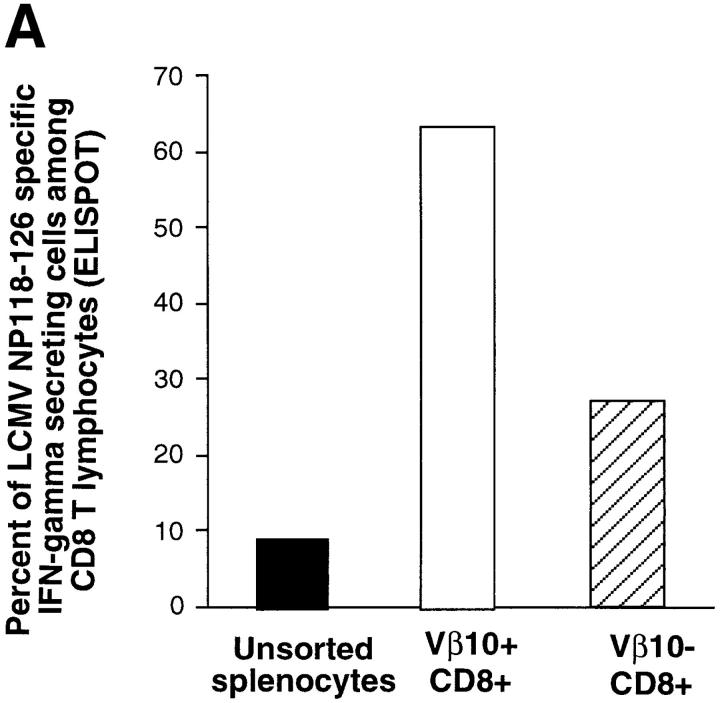
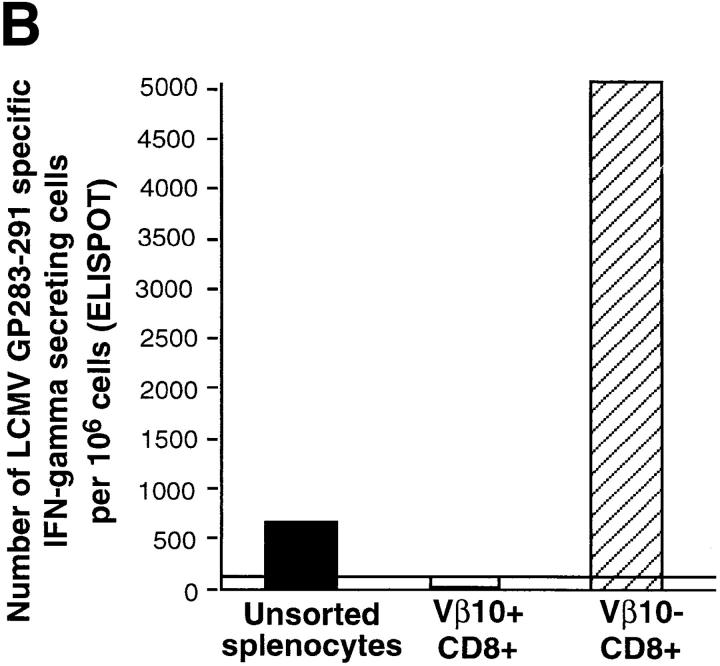
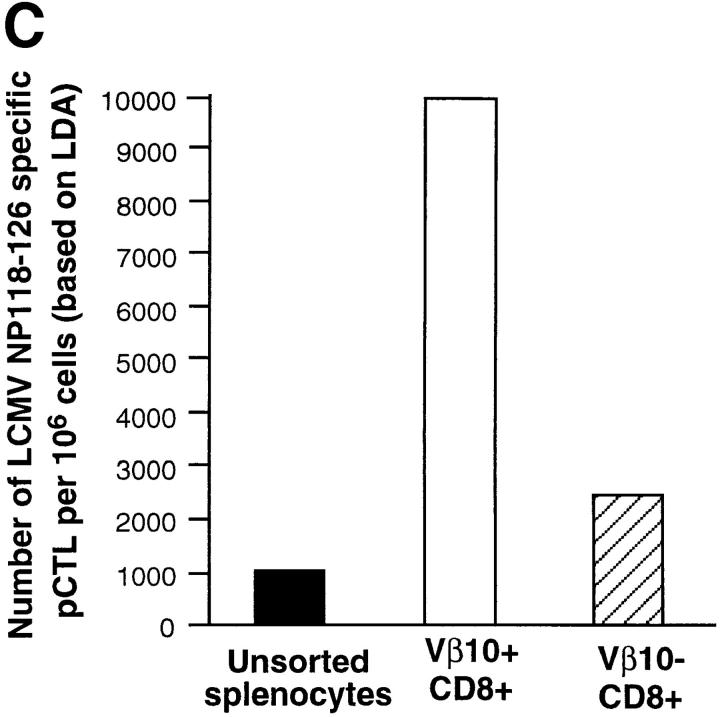
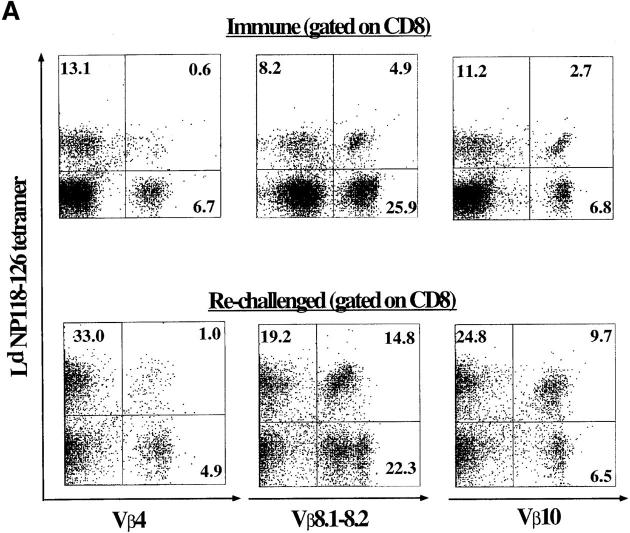
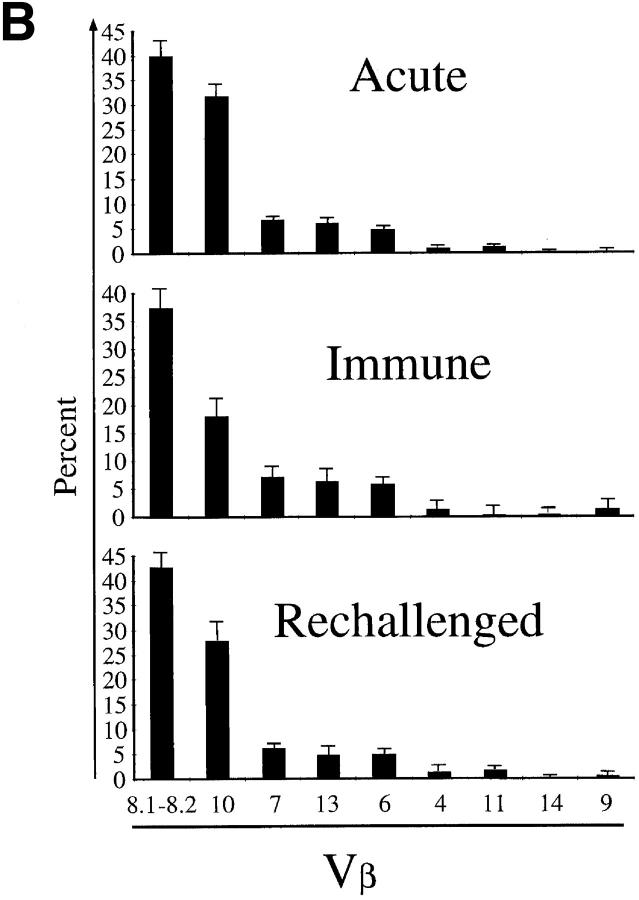
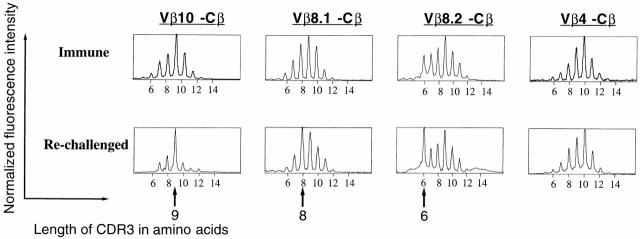
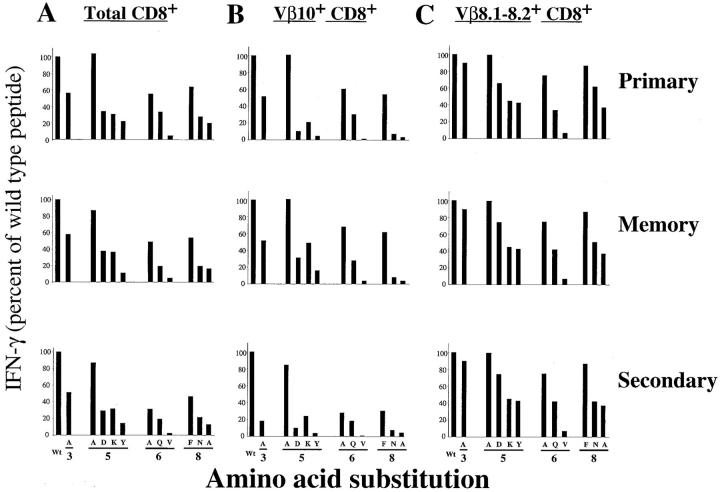
Viral infections often induce potent CD8 T cell responses that play a key role in antiviral immunity. After viral clearance, the vast majority of the expanded CD8 T cells undergo apoptosis, leaving behind a stable number of memory cells. The relationship between the CD8 T cells that clear the acute viral infection and the long-lived CD8 memory pool remaining in the individual is not fully understood. To address this issue, we examined the T cell receptor (TCR) repertoire of virus-specific CD8 T cells in the mouse model of infection with lymphocytic choriomeningitis virus (LCMV) using three approaches: (a) in vivo quantitative TCR beta chain V segment and complementarity determining region 3 (CDR3) length repertoire analysis by spectratyping (immunoscope); (b) identification of LCMV-specific CD8 T cells with MHC class I tetramers containing viral peptide and costaining with TCR Vbeta-specific antibodies; and (c) functional TCR fingerprinting based on recognition of variant peptides. We compared the repertoire of CD8 T cells responding to acute primary and secondary LCMV infections, together with that of virus-specific memory T cells in immune mice. Our analysis showed that CD8 T cells from several Vbeta families participated in the anti-LCMV response directed to the dominant cytotoxic T lymphocyte (CTL) epitope (NP118-126). However, the bulk (approximately 70%) of this CTL response was due to three privileged T cell populations systematically expanding during LCMV infection. Approximately 30% of the response consisted of Vbeta10+ CD8 T cells with a beta chain CDR3 length of nine amino acids, and 40% consisted of Vbeta8.1+ (beta CDR3 = eight amino acids) and Vbeta8.2+ cells (beta CDR3 = six amino acids). Finally, we showed that the TCR repertoire of the primary antiviral CD8 T cell response was similar both structurally and functionally to that of the memory pool and the secondary CD8 T cell effectors. These results suggest a stochastic selection of memory cells from the pool of CD8 T cells activated during primary infection.


Figures

Figure 5
Figure 5
Intracellular staining for IFN-γ. Splenocytes from BALB/c mice at day 8 after LCMV infection were incubated with or without NP118–126 peptide and stained for CD8, Vβ10, or Vβ8.1–8.2 and intracellular IFN-γ. The panels show the Vβ10 or Vβ8.1–8.2 and intracellular IFN-γ analyses of gated CD8+ cells. All numbers are in percentage of gated cells.
Figure 5
Figure 5
Intracellular staining for IFN-γ. Splenocytes from BALB/c mice at day 8 after LCMV infection were incubated with or without NP118–126 peptide and stained for CD8, Vβ10, or Vβ8.1–8.2 and intracellular IFN-γ. The panels show the Vβ10 or Vβ8.1–8.2 and intracellular IFN-γ analyses of gated CD8+ cells. All numbers are in percentage of gated cells.
Figure 1
Figure 1
Profiles of the Vβ10, Vβ8.1, Vβ8.2, and Vβ4 subrepertoires in spleen cells from naive and LCMV-infected (day 8) BALB/c mice. x-axis, Lengths in amino acids of the CDR3 regions; y-axis, fluorescence intensities, reflecting the number of clones using each Vβ/ CDR3 length combination. Each plot is normalized; therefore, the unit of the ordinate is arbitrary. Arrows, Position of the major public responses.
Figure 2
Figure 2
Kinetics of CD8+ T cell expansion and decline. Quantitation of total CD8+ (A), Vβ4+CD8+ (B), Vβ10+CD8+ (C), or Vβ8.1– 8.2+CD8+ (D) cells in the spleen during the course of acute LCMV infection. Each point represents an individual mouse.
Figure 3
Figure 3
Activation status of Vβ10+ and Vβ8.1–8.2+ cells in naive, acute (day 8 after infection), and immune (>day 38 after infection) mice. (A) LFA1 analyses of CD8+Vβ10+ or CD8+Vβ8.1–8.2+ gated cells. All numbers are in percentage of gated cells. (B) Comparison of the frequencies of Vβ10+ and Vβ8.1–8.2+ cells among CD8+LFA1high and CD8+LFA1low cells. White bars, Naive; black bars, acute; striped bars, immune. The values plotted are averages ± SEs calculated from seven mice.
Figure 3
Figure 3
Activation status of Vβ10+ and Vβ8.1–8.2+ cells in naive, acute (day 8 after infection), and immune (>day 38 after infection) mice. (A) LFA1 analyses of CD8+Vβ10+ or CD8+Vβ8.1–8.2+ gated cells. All numbers are in percentage of gated cells. (B) Comparison of the frequencies of Vβ10+ and Vβ8.1–8.2+ cells among CD8+LFA1high and CD8+LFA1low cells. White bars, Naive; black bars, acute; striped bars, immune. The values plotted are averages ± SEs calculated from seven mice.
Figure 4
Figure 4
TCR usage of LCMV NP118–126-specific CD8 T cells. (A) Flow cytometry analyses of Ld-NP118–126 tetramer–stained cells. Spleen cells from naive or LCMV acute mice (day 8) were stained with Ld-NP118–126 tetramers, and antibodies to CD8 as well as to Vβ4, Vβ8.1– 8.2, or Vβ10. FACS® events were gated on CD8+ cells. All numbers are in percentage of gated cells. (B) Summary of Vβ usage among LCMV-specific CD8 T cells (black bars), non-LCMV–specific CD8 T cells (striped bars), and naive CD8 T cells (white bars). All values are expressed in percent and are averaged from three to six mice.
Figure 4
Figure 4
TCR usage of LCMV NP118–126-specific CD8 T cells. (A) Flow cytometry analyses of Ld-NP118–126 tetramer–stained cells. Spleen cells from naive or LCMV acute mice (day 8) were stained with Ld-NP118–126 tetramers, and antibodies to CD8 as well as to Vβ4, Vβ8.1– 8.2, or Vβ10. FACS® events were gated on CD8+ cells. All numbers are in percentage of gated cells. (B) Summary of Vβ usage among LCMV-specific CD8 T cells (black bars), non-LCMV–specific CD8 T cells (striped bars), and naive CD8 T cells (white bars). All values are expressed in percent and are averaged from three to six mice.
Figure 6
Figure 6
Functional analyses of sorted Vβ10+CD8+ and Vβ10CD8+ cells. IFN-γ ELISPOT assays measuring the frequencies of LCMV-specific T cells in the unsorted or sorted populations. (A) Frequencies of NP118–126-specific cells. (B) Frequencies of GP283–292-specific T cells. (C) LDA of NP118–126-specific CTL precursor in the unsorted or sorted populations.
Figure 6
Figure 6
Functional analyses of sorted Vβ10+CD8+ and Vβ10CD8+ cells. IFN-γ ELISPOT assays measuring the frequencies of LCMV-specific T cells in the unsorted or sorted populations. (A) Frequencies of NP118–126-specific cells. (B) Frequencies of GP283–292-specific T cells. (C) LDA of NP118–126-specific CTL precursor in the unsorted or sorted populations.
Figure 7
Figure 7
TCR repertoire analysis of LCMV-specific CD8 T cells in immune and rechallenged mice. (A) Vβ4, Vβ10, or Vβ8.1–8.2 and Ld-NP118–126 analyses on gated CD8+ T cells from an LCMV-immune mouse and an immune mouse 5 d after rechallenge with LCMV. The figures are in percentage of total CD8 T cells. (B) Summary of TCR Vβ usage in acute, immune, and rechallenged mice. The values plotted are averaged from three to six mice. The total number of Ld-NP118–126+-specific cells per spleen was 11.1 × 10⁶ ± 2 × 10⁶ in acute mice, 9.7 × 10⁵ ± 2 × 10⁵ in immune mice, and 5.1 × 10⁶ ± 0.8 × 10⁶ in rechallenged mice.
Figure 7
Figure 7
TCR repertoire analysis of LCMV-specific CD8 T cells in immune and rechallenged mice. (A) Vβ4, Vβ10, or Vβ8.1–8.2 and Ld-NP118–126 analyses on gated CD8+ T cells from an LCMV-immune mouse and an immune mouse 5 d after rechallenge with LCMV. The figures are in percentage of total CD8 T cells. (B) Summary of TCR Vβ usage in acute, immune, and rechallenged mice. The values plotted are averaged from three to six mice. The total number of Ld-NP118–126+-specific cells per spleen was 11.1 × 10⁶ ± 2 × 10⁶ in acute mice, 9.7 × 10⁵ ± 2 × 10⁵ in immune mice, and 5.1 × 10⁶ ± 0.8 × 10⁶ in rechallenged mice.
Figure 8
Figure 8
Profiles of the Vβ10, Vβ8.1, Vβ8.2, and Vβ4 subrepertoires in the secondary response of BALB/c mice to LCMV. Top, Profiles at 125 d after LCMV infection. Bottom, Profiles of an immune mouse at day 5 after rechallenge with LCMV. x-axis, Lengths in amino acids of the CDR3 regions; y-axis, fluorescence intensities (reflecting the number of clones with a particular CDR3 length using Vβ10, Vβ8.1, Vβ8.2, or Vβ4). Arrows, Position of the major public responses.
Figure 9
Figure 9
TCR functional fingerprinting of LCMV NP118–126-specific CD8 T cells. TCR fingerprints of total CD8 T cells (A), Vβ10+CD8+ (B), and Vβ 8.1–8.2+CD8+ cells (C). Primary effectors (top), memory T cells (middle), or secondary effectors (bottom) were tested for IFN-γ secretion with variant peptides derived from NP118–126. The number of IFN-γ–secreting cells seen after stimulation with variant peptides was normalized to the number obtained with the wild-type peptide (Wt) and is expressed as percentage of wild-type response. The data shown are representative of six experiments.

Similar articles

Cited by

References

    1. Ahmed R, Gray D. Immunological memory and protective immunity: understanding their relation. Science. 1996;272:54–60. - PubMed
    1. Wilson RK, Lai E, Concannon P, Barth RK, Hood LE. Structure, organization and polymorphism of murine and human T-cell receptor alpha and beta chain gene families. Immunol Rev. 1988;101:149–172. - PubMed
    1. Davis MM. T cell receptor gene diversity and selection. Annu Rev Biochem. 1990;59:475–496. - PubMed
    1. Goverman J, Minard K, Shastri N, Hunkapiller T, Hansburg D, Sercarz E, Hood L. Rearranged beta T cell receptor genes in a helper T cell clone specific for lysozyme: no correlation between V beta and MHC restriction. Cell. 1985;40:859–867. - PubMed
    1. Goverman J, Hunkapiller T, Hood L. A speculative view of the multicomponent nature of T cell antigen recognition. Cell. 1986;45:475–484. - PubMed

Publication types

MeSH terms

Substances