. 1998 Jul 6;188(1):169-80.
doi: 10.1084/jem.188.1.169.

B lymphocytes producing demyelinating autoantibodies: development and function in gene-targeted transgenic mice

Affiliations

B lymphocytes producing demyelinating autoantibodies: development and function in gene-targeted transgenic mice

T Litzenburger et al. J Exp Med. .

Abstract

We studied the cellular basis of self tolerance of B cells specific for brain autoantigens using transgenic mice engineered to produce high titers of autoantibodies against the myelin oligodendrocyte glycoprotein (MOG), a surface component of central nervous system myelin. We generated "knock-in" mice by replacing the germline JH locus with the rearranged immunoglobulin (Ig) H chain variable (V) gene of a pathogenic MOG-specific monoclonal antibody. In the transgenic mice, conventional B cells reach normal numbers in bone marrow and periphery and express exclusively transgenic H chains, resulting in high titers of MOG-specific serum Igs. Additionally, about one third of transgenic B cells bind MOG, thus demonstrating the absence of active tolerization. Furthermore, peritoneal B-1 lymphocytes are strongly depleted. Upon immunization with MOG, the mature transgenic B cell population undergoes normal differentiation to plasma cells secreting MOG-specific IgG antibodies, during which both Ig isotype switching and somatic mutation occur. In naive transgenic mice, the presence of this substantial autoreactive B cell population is benign, and the mice fail to develop either spontaneous neurological disease or pathological evidence of demyelination. However, the presence of the transgene both accelerates and exacerbates experimental autoimmune encephalitis, irrespective of the identity of the initial autoimmune insult.


Figures

Figure 1
Figure 1
Site-directed replacement of the JH locus with the Thmog gene. (A) Structure and partial restriction map of the wild-type IgH locus and the targeted insertion. Filled boxes, the DQ52 and JH elements; open oval, the 3′ enhancer region. Arrows, The transcriptional orientation of the Th (VDJ 8.18; hatched box) and the neor gene. Diagnostic restriction fragments and location of the probe (0.8 EH) used for Southern blot analysis are shown. N, NaeI; RI, EcoRI; S, SacI; Xh, XhoI. (B) Southern blot analysis of ES cell–derived offspring. SacI-digested tail DNA from offspring of heterozygous mutant mice was hybridized to the probe 0.8 EH. Homozygous mutant animals (Th/Th) show only a 2-kb hybridizing fragment, whereas heterozygous mutants (Th/+) show both a 4- and a 2-kb fragment.
Figure 1
Figure 1
Site-directed replacement of the JH locus with the Thmog gene. (A) Structure and partial restriction map of the wild-type IgH locus and the targeted insertion. Filled boxes, the DQ52 and JH elements; open oval, the 3′ enhancer region. Arrows, The transcriptional orientation of the Th (VDJ 8.18; hatched box) and the neor gene. Diagnostic restriction fragments and location of the probe (0.8 EH) used for Southern blot analysis are shown. N, NaeI; RI, EcoRI; S, SacI; Xh, XhoI. (B) Southern blot analysis of ES cell–derived offspring. SacI-digested tail DNA from offspring of heterozygous mutant mice was hybridized to the probe 0.8 EH. Homozygous mutant animals (Th/Th) show only a 2-kb hybridizing fragment, whereas heterozygous mutants (Th/+) show both a 4- and a 2-kb fragment.
Figure 2
Figure 2
Serum Igs of Th-transgenic mice react specifically with recombinant and native brain-derived mouse MOG. (A) Relative concentrations of total (top) and MOG-specific (bottom) IgMa and IgMb allotypes in the blood of 6-wk-old homozygous (Th/Th; n = 4), heterozygous mutant (Th/+; n = 4), and wild-type (+/+; n = 4) mice by ELISA. The serum dilutions were 1:50 for measurement of MOG-specific IgMa and IgMb and 1:6,250 for MOG-specific IgG. Nonspecific binding to BSA (blocking reagent) was substracted from all values to calculate the mean absorbance (OD 405 nm) ± SE. (B) MOG binding specificity of serum Igs derived from homozygous mutant (Th/Th) and wild-type (+/+) mice, analyzed by Western blot. Mouse brain–extracted proteins and rMOG separated by SDS-PAGE and blotted onto nitrocellulose membrane were incubated with wild-type serum (left), the 8.18-C5 mAb (middle), and serum from homozygous mutant mice (Th/Th; right). The sizes of the molecular weight standard are indicated (left), and the position of rMOG- and brain-derived MOG are marked (arrows, right).
Figure 2
Figure 2
Serum Igs of Th-transgenic mice react specifically with recombinant and native brain-derived mouse MOG. (A) Relative concentrations of total (top) and MOG-specific (bottom) IgMa and IgMb allotypes in the blood of 6-wk-old homozygous (Th/Th; n = 4), heterozygous mutant (Th/+; n = 4), and wild-type (+/+; n = 4) mice by ELISA. The serum dilutions were 1:50 for measurement of MOG-specific IgMa and IgMb and 1:6,250 for MOG-specific IgG. Nonspecific binding to BSA (blocking reagent) was substracted from all values to calculate the mean absorbance (OD 405 nm) ± SE. (B) MOG binding specificity of serum Igs derived from homozygous mutant (Th/Th) and wild-type (+/+) mice, analyzed by Western blot. Mouse brain–extracted proteins and rMOG separated by SDS-PAGE and blotted onto nitrocellulose membrane were incubated with wild-type serum (left), the 8.18-C5 mAb (middle), and serum from homozygous mutant mice (Th/Th; right). The sizes of the molecular weight standard are indicated (left), and the position of rMOG- and brain-derived MOG are marked (arrows, right).
Figure 3
Figure 3
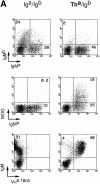
Surface phenotype of lymphocytes isolated from spleen (A), bone marrow (B), and peripheral blood (C) of wild-type (+a/+b), heterozygous (Tha/+b), and homozygous (Tha/Tha) mutant 8-wk-old mice. Cells were stained with anti-IgMa mAb, anti-IgMb Mab, biotinylated rMOG, anti-B220, anti-CD43, and an idiotype-specific Ab (VH 8.18-C5) as indicated. Numbers in quadrants refer to the percentage of cells in the lymphocyte gate as defined by forward and side scatter.
Figure 3
Figure 3
Surface phenotype of lymphocytes isolated from spleen (A), bone marrow (B), and peripheral blood (C) of wild-type (+a/+b), heterozygous (Tha/+b), and homozygous (Tha/Tha) mutant 8-wk-old mice. Cells were stained with anti-IgMa mAb, anti-IgMb Mab, biotinylated rMOG, anti-B220, anti-CD43, and an idiotype-specific Ab (VH 8.18-C5) as indicated. Numbers in quadrants refer to the percentage of cells in the lymphocyte gate as defined by forward and side scatter.
Figure 4
Figure 4
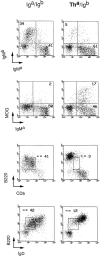
Flow cytometry of peritoneal B cells from wild-type (+a/+b) and heterozygous mutant (Tha/+b) 8-wk-old mice. Cells were stained with anti-IgMa and -IgMb allotype–specific Abs and MOG as shown previously in Fig. 3. Double stainings of either CD5 or IgD combined with anti-B220 identify CD5-positive B-1 cells, characterized by low expression of B220 and IgD. Boxes, B220dullCD5+ cells and B220dullIgDdull cells; percentages in a given box are shown for each plot.
Figure 5
Figure 5
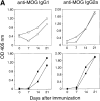
Ab response of Th-transgenic mice immunized with rMOG in CFA. (A) MOG-specific IgG1 and IgG2a Abs were measured in the serum (diluted 1: 360) of homozygous mutant mice (Th/Th; top) and wild-type controls (+/+; bottom) by ELISA (see Fig. 2). Samples were taken before immunization and 7, 14, and 21 d after antigenic challenge. Two mice of each group are shown. (B) The epitope specificity of serum Igs was analyzed in heterozygous mutant (Th/+) and wild-type (+/+) mice 14 d after MOG immunization. A panel of overlapping peptides spanning the extracellular region of MOG including NH2-terminal (N-term) and COOH-terminal (HIS-tag) peptides of rMOG was used to measure specific reactivity by ELISA (OD 405 nm). Purified 8.18-C5 mAb (pur. 8.18c5) was used at a concentration of 2 μg/ml, and the serum was diluted 1:100 and developed with goat anti–mouse Ig.
Figure 5
Figure 5
Ab response of Th-transgenic mice immunized with rMOG in CFA. (A) MOG-specific IgG1 and IgG2a Abs were measured in the serum (diluted 1: 360) of homozygous mutant mice (Th/Th; top) and wild-type controls (+/+; bottom) by ELISA (see Fig. 2). Samples were taken before immunization and 7, 14, and 21 d after antigenic challenge. Two mice of each group are shown. (B) The epitope specificity of serum Igs was analyzed in heterozygous mutant (Th/+) and wild-type (+/+) mice 14 d after MOG immunization. A panel of overlapping peptides spanning the extracellular region of MOG including NH2-terminal (N-term) and COOH-terminal (HIS-tag) peptides of rMOG was used to measure specific reactivity by ELISA (OD 405 nm). Purified 8.18-C5 mAb (pur. 8.18c5) was used at a concentration of 2 μg/ml, and the serum was diluted 1:100 and developed with goat anti–mouse Ig.
Figure 6
Figure 6
Somatic hypermutation of the transgenic Th gene sequence obtained from homozygous mutant (Th/Th) mice before (day 0) and 14 d after priming with rMOG. Deduced amino acid sequences are compared with that of the 8.18-C5 gene. Dashes, identity; amino acid substitutions are shown; dots, silent mutations. The sequence data are available from GenBank under the accession number AF042086.
Figure 6
Figure 6
Somatic hypermutation of the transgenic Th gene sequence obtained from homozygous mutant (Th/Th) mice before (day 0) and 14 d after priming with rMOG. Deduced amino acid sequences are compared with that of the 8.18-C5 gene. Dashes, identity; amino acid substitutions are shown; dots, silent mutations. The sequence data are available from GenBank under the accession number AF042086.
Figure 7
Figure 7
Development of clinical EAE in four wild type (+/+; top) and four heterozygous mutant (Th/+; bottom) mice after immunization with peptide PLP 139–154 in CFA. The clinical score (y-axis) and weight (not shown) were monitored daily over a period of 40 d (x-axis) after injection. The shown data are representative of a larger group of immunized animals summarized in Table 1.
Figure 8
Figure 8
Histological staining on paraffin-embedded spinal cord sections of Th transgenic and wild-type mice after induction of EAE with PLP 139– 154 peptide. On day 9 after immunization, early demyelination is found in Th knock-in animals (B) but not in littermate control mice (A). Large cellular infiltrates are detectable within the areas of demyelination after hematoxylin/eosin staining of sections of Th mice (D) but not in sections of control animals (C).

References

    1. Kantor AB, Herzenberg LA. Origin of murine B cell lineages. Annu Rev Immunol. 1993;11:501–538. - PubMed
    1. Hardy RR, Carmack CE, Li YS, Hayakawa K. Distinctive developmental origins and specificities of murine CD5+B cells. Immunol Rev. 1994;137:91–118. - PubMed
    1. Nemazee DA, Buerki K. Clonal deletion of B lymphocytes in a transgenic mouse bearing anti-class I antibody genes. Nature. 1989;337:562–566. - PubMed
    1. Hartley SB, Crosbie J, Brink R, Kantor AB, Basten A, Goodnow CC. Elimination from peripheral lymphoid tissues of self-reactive B lymphocytes recognizing membrane-bound antigens. Nature. 1991;353:765–769. - PubMed
    1. Chen C, Nagy Z, Radic MZ, Hardy RR, Huszar D, Camper SA, Weigert M. The site and stage of anti-DNA B cell deletion. Nature. 1995;373:252–255. - PubMed

Publication types

MeSH terms

Associated data