. 1998 Jul 6;188(1):181-91.
doi: 10.1084/jem.188.1.181.

Epstein-Barr virus-induced molecule 1 ligand chemokine is expressed by dendritic cells in lymphoid tissues and strongly attracts naive T cells and activated B cells

Affiliations

Epstein-Barr virus-induced molecule 1 ligand chemokine is expressed by dendritic cells in lymphoid tissues and strongly attracts naive T cells and activated B cells

V N Ngo et al. J Exp Med. .

Abstract

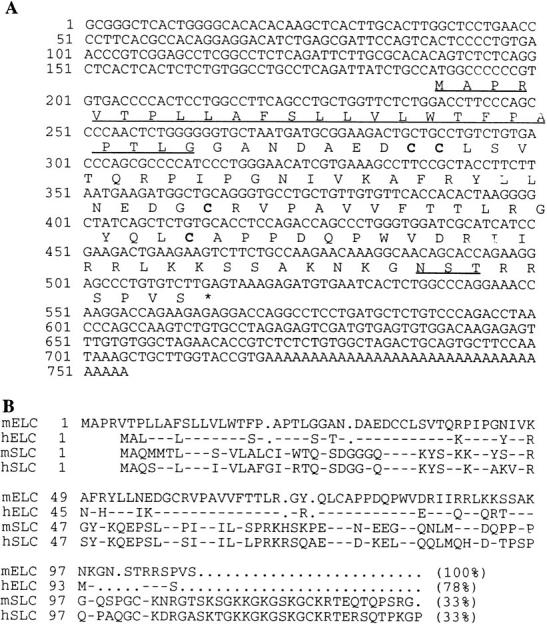
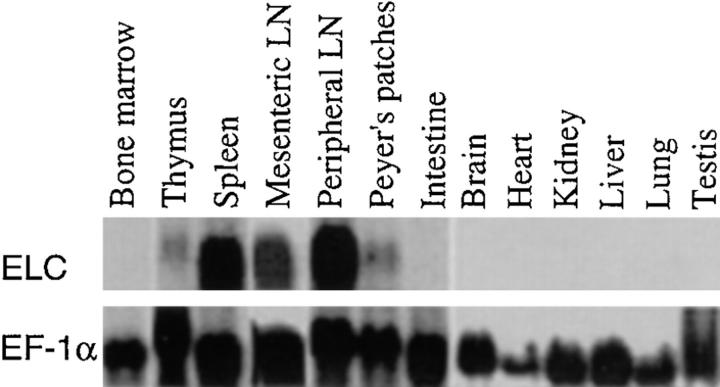
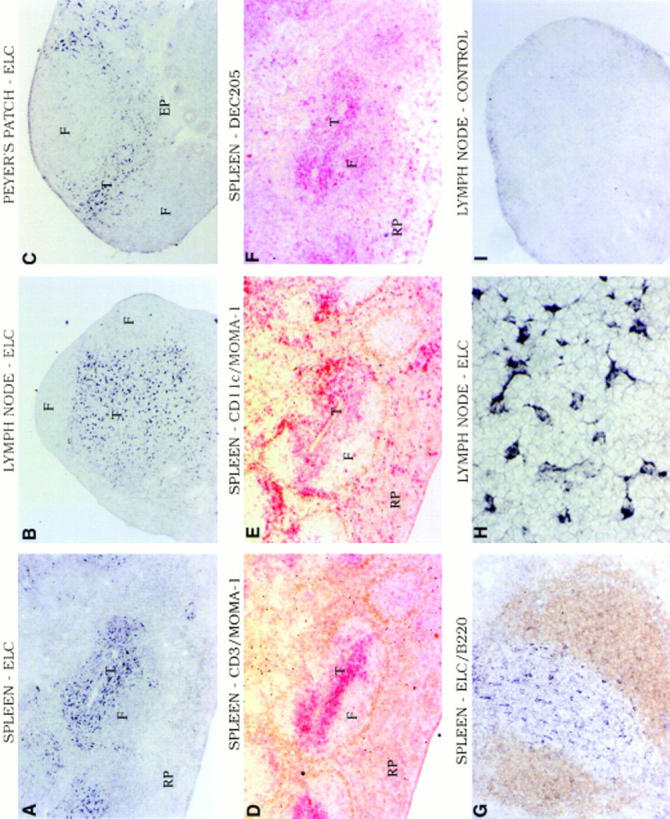
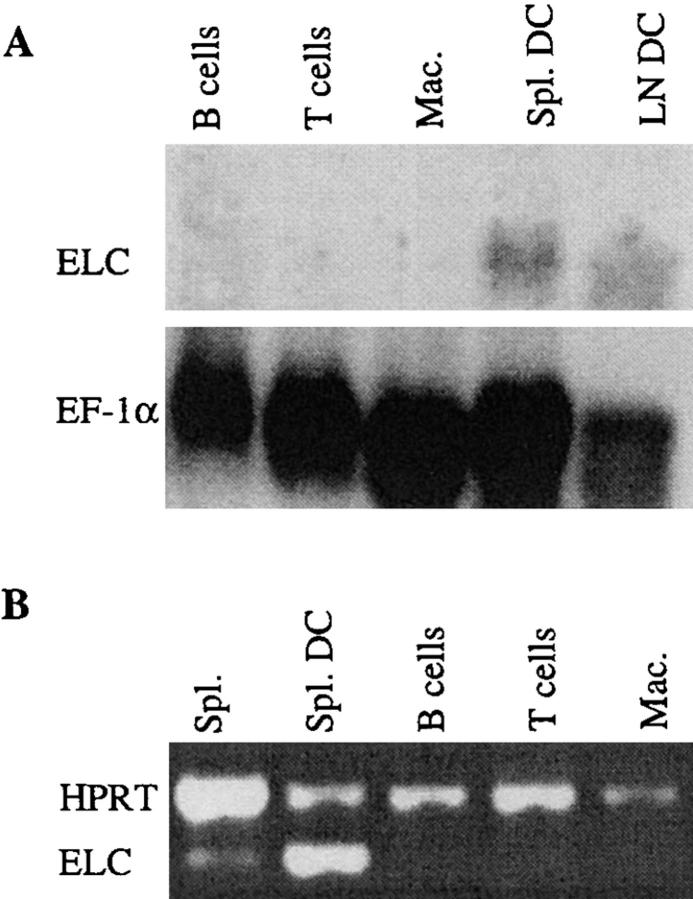
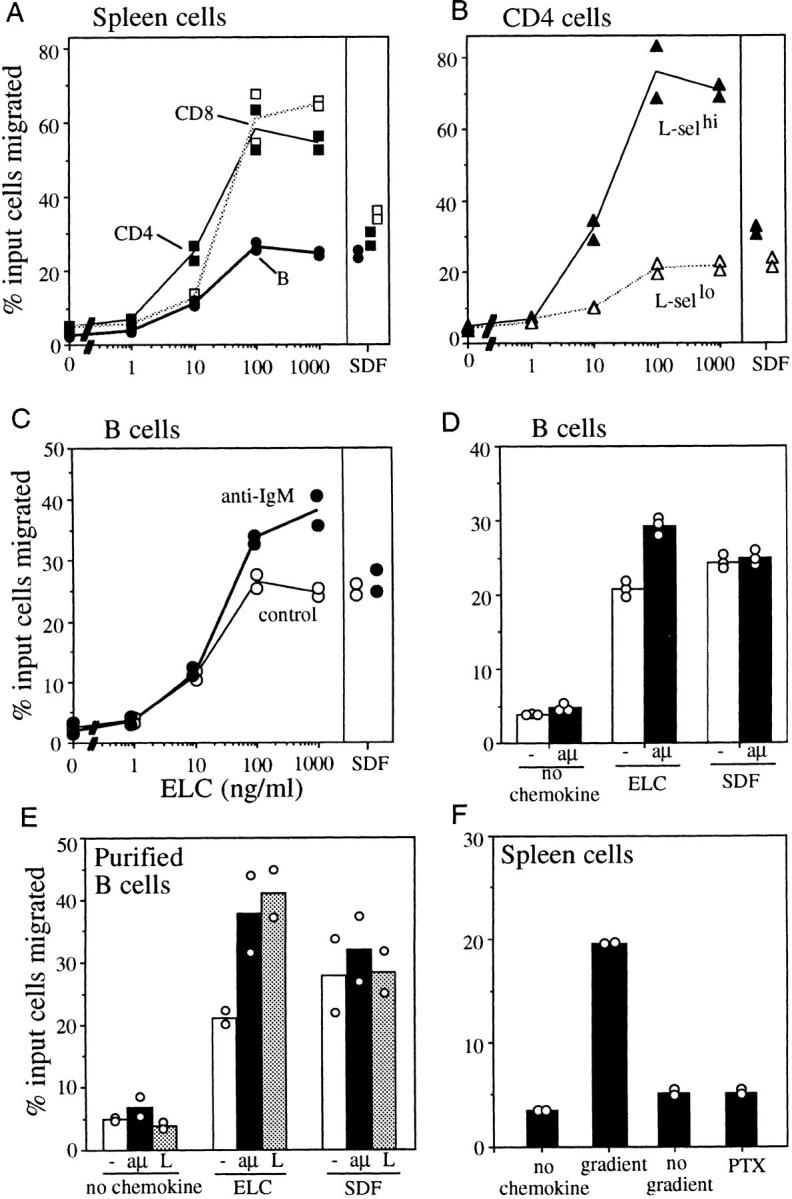
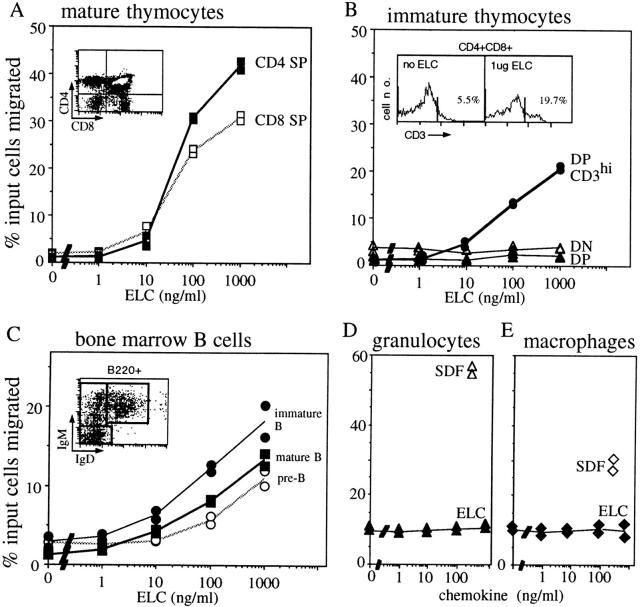
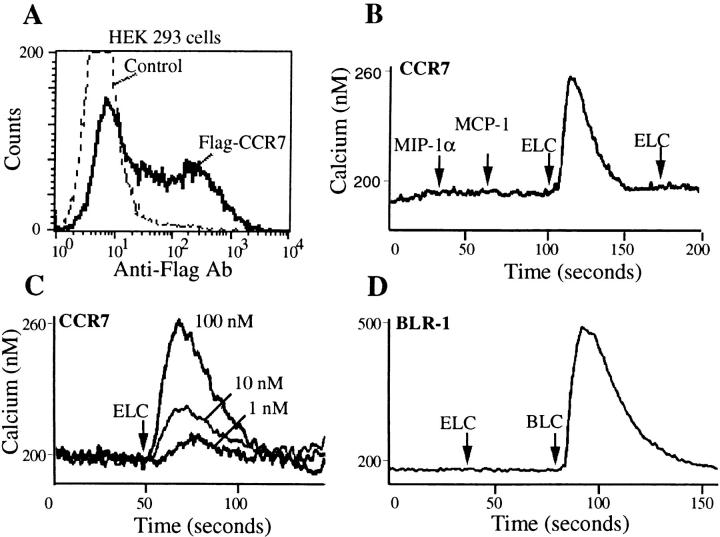
Movement of T and B lymphocytes through secondary lymphoid tissues is likely to involve multiple cues that help the cells navigate to appropriate compartments. Epstein-Barr virus- induced molecule 1 (EBI-1) ligand chemokine (ELC/MIP3beta) is expressed constitutively within lymphoid tissues and may act as such a guidance cue. Here, we have isolated mouse ELC and characterized its expression pattern and chemotactic properties. ELC is expressed constitutively in dendritic cells within the T cell zone of secondary lymphoid tissues. Recombinant ELC was strongly chemotactic for naive (L-selectinhi) CD4 T cells and for CD8 T cells and weakly attractive for resting B cells and memory (L-selectinlo) CD4 T cells. After activation through the B cell receptor, the chemotactic response of B cells was enhanced. Like its human counterpart, murine ELC stimulated cells transfected with EBI-1/CC chemokine receptor 7 (CCR7). Our findings suggest a central role for ELC in promoting encounters between recirculating T cells and dendritic cells and in the migration of activated B cells into the T zone of secondary lymphoid tissues.


Figures

Figure 1
Figure 1
Mouse ELC sequence and alignment with human ELC and SLC. (A) Nucleotide and deduced amino acid sequence of mouse ELC. The predicted signal sequence is underlined, cysteines are shown in bold, and a single potential N-linked glycosylation site is underlined. (B) Alignment of mouse ELC (mELC) protein sequence with those of human ELC (hELC) and mouse and human SLC (mSLC and hSLC). Identical amino acids are shown as hyphens, and dots represent gaps inserted for optimum alignment. Numbering is with respect to the first amino acid shown in the full-length protein. These sequence data are available from EMBL/ GenBank/DDBJ under accession no. AF059208.
Figure 2
Figure 2
Northern blotting analysis of ELC expression in mouse tissues. Top, Hybridization with ELC probe. Bottom, Hybridization with EF-1α to control for amounts of RNA loaded.
Figure 3
Figure 3
In situ hybridization analysis of ELC expression pattern in mouse lymphoid tissues. (A–C and G–I) Bright-field micrographs showing hybridization with digoxigenin-labeled antisense (A–C, G, and H) or sense (I) ELC probe to sections of spleen (A and G), mesenteric LN (B, H, and I), and Peyer's patch (C). Signal is seen as black staining. (D–F) Immunohistochemistry of spleen sections serial to A to detect in brown MOMA-1–positive marginal metallophilic macrophages (D and E) and in red CD3+ T cells (D), CD11c-expressing DCs (E) and DEC205-expressing DCs (F). The spleen section in G was double stained to detect B220 (brown) and ELC (black). T, T zone; F, follicle; RP, red pulp; EP, epithelium. Original magnifications: A–F and I, ×5 objective; G, ×10 objective; and H, ×40 objective.
Figure 4
Figure 4
ELC expression in purified cells. (A) Northern blot analysis of ELC expression in MACS®-purified spleen B cells and T cells, mouse peritoneal macrophages (Mac.), and spleen (Spl.) and LN DCs purified to ∼70%. EF-1α hybridization is shown to control for amounts of RNA loaded. (B) RT-PCR analysis of ELC expression in total spleen before sorting (Spl.) and in splenic CD11c+ DCs isolated by FACS® sorting (Spl. DC), and lack of expression in purified spleen B cells and T cells and peritoneal macrophages (Mac.). Primers specific for HPRT were included in each sample as a reaction control.
Figure 5
Figure 5
Chemotactic activity of ELC on resting and acutely activated mouse lymphocytes. Results are expressed as the percentage of input cells of each subtype migrating to the lower chamber of a transwell filter. Panels show migration of spleen lymphocyte subsets: (A) CD4 T cells, CD8 T cells, and B cells; (B) L-selectinhi and L-selectinlo CD4 T cells; (C) B cells preincubated with anti-IgM (17 μg/ml) or media alone (control) for 4 h; (D) duplicate experiment to C with cells preincubated with media alone (−) or anti-IgM (aμ) for 4 h; (E) purified B cells preincubated with media alone (−), anti-IgM at 17 μg/ml (aμ), or LPS at 20 μg/ml (L) for 6 h; (F) total spleen cells in the absence of a gradient (no gradient, equal concentration of ELC in upper and lower chamber) or preincubated with pertussis toxin at 200 ng/ml (PTX) for 2 h. In A–E, SDF1α was included at 300 ng/ml as a positive control. In D, ELC was at 200 ng/ml, and in E and F at 300 ng/ml. The results in A–C are representative of three independent experiments, and results in D–F of two experiments.
Figure 6
Figure 6
Chemotactic activity of ELC on immature T and B cells and lack of activity on granulocytes and macrophages. Results are expressed as the percentage of input cells of each subtype migrating to the lower chamber of a transwell filter. Panels show response of (A) mature CD4 and CD8 single positive (SP) thymocytes; (B) immature CD4/CD8 double negative (DN) thymocytes, total CD4/CD8 double positive (DP) thymocytes, and CD3hi double positive thymocytes; (C) bone marrow B220+IgM−IgD− cells (pre-B), B220+IgM+IgD− cells (immature B), and B220+IgM+IgD+ cells (mature B); (D) bone marrow granulocytes; and (E) spleen macrophages. Insets in A and C show flow cytometric profiles of input cells and gates used to measure the frequency of each cell type. The profile in C has already been gated for B220+ cells. The inset in B shows the gate used to identify high CD3 expression on double positive thymocytes and, as an example, the fraction of CD3hi double positive cells that migrated in the absence of ELC or in response to 1 μg/ml ELC. In D and E, SDF1α (300 ng/ml) is included as a positive control. Each experiment was performed a minimum of two times.
Figure 7
Figure 7
Mouse CCR7/EBI-1 mediated calcium mobilization in response to ELC. (A) Flow cytometric analysis of FLAG-tagged CCR7 expression on HEK293 cells transiently transfected with CCR7 expression vector (Flag-CCR7) compared with cells stained without primary antibody (Control). (B) Calcium flux of CCR7-expressing cells in response to mouse ELC (1 μg/ml) but not MIP1α (0.2 μg/ml) or MCP1 (0.2 μg/ml). (C) Calcium flux of CCR7-expressing cells as a function of ELC concentration. (D) Lack of response of BLR1-transfected HEK293 cells to ELC (1 μg/ml). BLC (2 μg/ml) was used as positive control.

References

    1. Austyn JM. New insights into the mobilization and phagocytic activity of dendritic cells. J Exp Med. 1996;183:1287–1292. - PMC - PubMed
    1. Hart DN. Dendritic cells: unique leukocyte populations which control the primary immune response. Blood. 1997;90:3245–3287. - PubMed
    1. Steinman RM, Pack M, Inaba K. Dendritic cells in the T-cell areas of lymphoid organs. Immunol Rev. 1997;156:25–37. - PubMed
    1. Ingulli E, Mondino A, Khoruts A, Jenkins MK. In vivo detection of dendritic cell antigen presentation to CD4(+) T cells. J Exp Med. 1997;185:2133–2141. - PMC - PubMed
    1. Niewenhuis P, Ford WL. Comparative migration of B- and T-lymphocytes in the rat spleen and lymph nodes. Cell Immunol. 1976;23:254–267. - PubMed

Publication types

MeSH terms