. 1998 Jul 7;95(14):8046-51.
doi: 10.1073/pnas.95.14.8046.

Automated high resolution optical mapping using arrayed, fluid-fixed DNA molecules

Affiliations

Automated high resolution optical mapping using arrayed, fluid-fixed DNA molecules

J Jing et al. Proc Natl Acad Sci U S A. .

Abstract

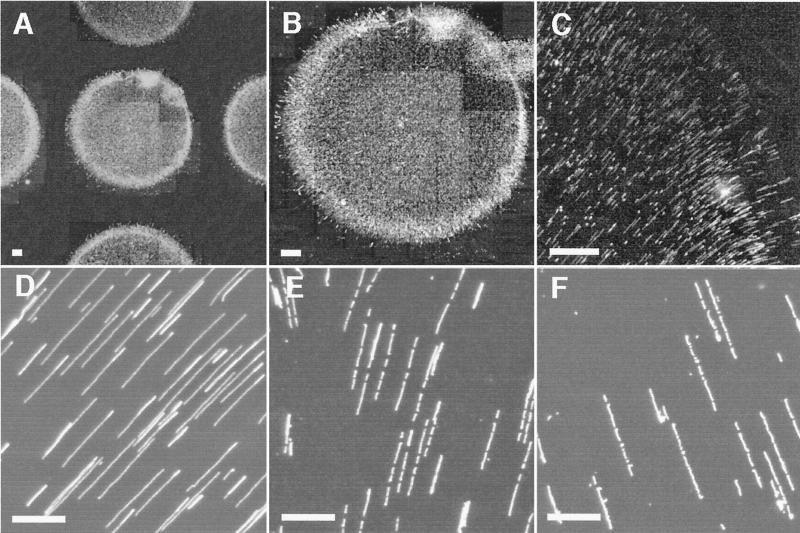
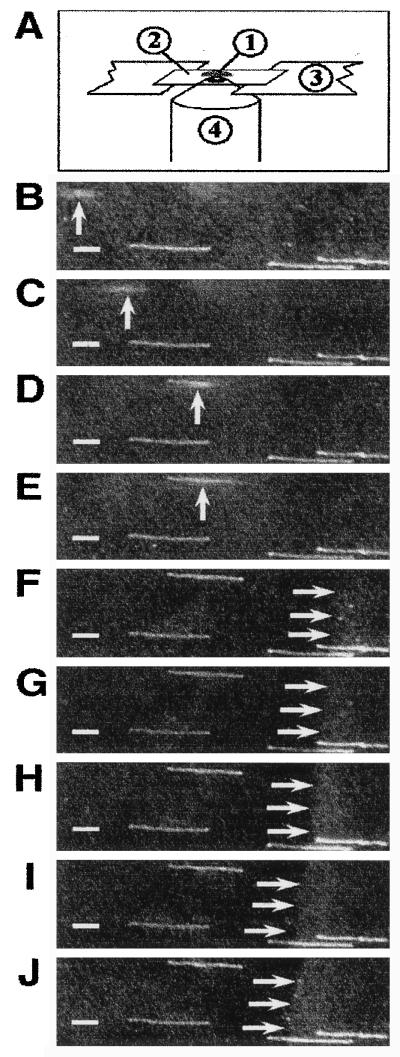
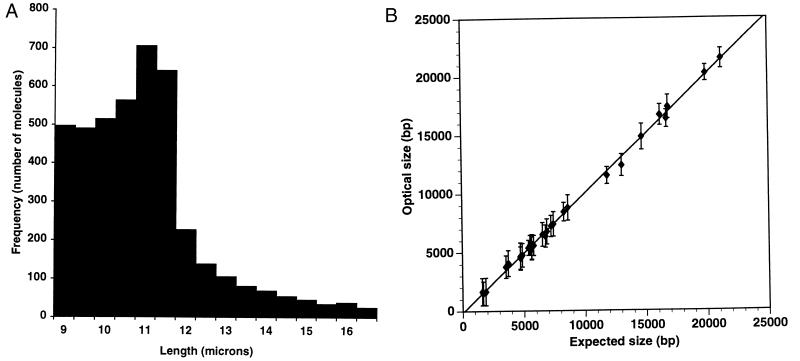
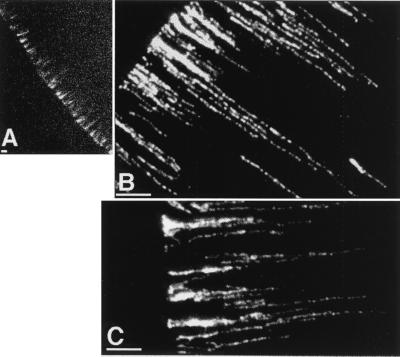
New mapping approaches construct ordered restriction maps from fluorescence microscope images of individual, endonuclease-digested DNA molecules. In optical mapping, molecules are elongated and fixed onto derivatized glass surfaces, preserving biochemical accessibility and fragment order after enzymatic digestion. Measurements of relative fluorescence intensity and apparent length determine the sizes of restriction fragments, enabling ordered map construction without electrophoretic analysis. The optical mapping system reported here is based on our physical characterization of an effect using fluid flows developed within tiny, evaporating droplets to elongate and fix DNA molecules onto derivatized surfaces. Such evaporation-driven molecular fixation produces well elongated molecules accessible to restriction endonucleases, and notably, DNA polymerase I. We then developed the robotic means to grid DNA spots in well defined arrays that are digested and analyzed in parallel. To effectively harness this effect for high-throughput genome mapping, we developed: (i) machine vision and automatic image acquisition techniques to work with fixed, digested molecules within gridded samples, and (ii) Bayesian inference approaches that are used to analyze machine vision data, automatically producing high-resolution restriction maps from images of individual DNA molecules. The aggregate significance of this work is the development of an integrated system for mapping small insert clones allowing biochemical data obtained from engineered ensembles of individual molecules to be automatically accumulated and analyzed for map construction. These approaches are sufficiently general for varied biochemical analyses of individual molecules using statistically meaningful population sizes.


Figures

Figure 1
Figure 1
Digital fluorescence micrographs of gridded spots containing fluid-fixed molecules. Droplets of lambda bacteriophage DNA dissolved in Tris-EDTA buffer containing 0.5% glycerol deposited onto APTES-treated glass surfaces, dried and stained. (A) Section of a 10×10 spot grid on a derivatized surface. Image composed by tiling a series of 16× (objective power) images. (B) Close-up of a DNA spot within the grid. Image composed by tiling a series of 16× images. (C) Elongated DNA molecules on surface before restriction digestion (16×). (D) Magnified image of elongated DNA molecules contained within the spot shown in B before restriction digestion (100×). (E) DNA molecules in B, different field, after digestion with BamHI (100×). Note appearance of gaps signaling enzyme cleavage sites. (F) DNA molecules after digestion with AvaI, from another grid spot, using the same surface and spotting conditions (100×). [Bars: 20 μm (AC); 5 μm (DF).]
Figure 2
Figure 2
Fluid-fixation molecular events imaged by video microscopy during droplet drying. Fluorochrome-labeled lambda bacteriophage DNA solution droplet pipetted (1 μl) onto a derivatized surface and imaged during drying. (A) Schematic detailing experimental setup: 1, droplet; 2, surface; 3, support; 4, objective. Phase one: the droplet flattens (BE). (B) Several molecules are absorbed to the surface. A new molecule (vertical arrow) enters the field of view from the left (time = 0 s). (C) The molecule moves above the surface toward the edge of the droplet (0.10 s). (D and E) One end is adsorbed onto the surface and the molecule stretches out in the liquid flow (0.23–0.27 s). (F) The molecule elongates in the flow, sequentially attaching to the surface at several points along the backbone (0.30 s). Phase two: The contact line recedes (GJ, 2.53–3.20 s). DNA molecules are elongated and fixed before the receding liquid/air interface (horizontal arrows) sweeps by.
Figure 3
Figure 3
Evaluations of optical mapping molecular parameters and sizing error. (A) Histogram of lengths of spotted adenovirus type 2 DNA molecules. Lengths of 4,242 molecules from 11 spots (49 images per spot) measured by OMM were pooled and analyzed. Histogram shows the fraction (33.4%) of molecules that are sufficiently elongated for mapping (≥65% of the full contour length). The remaining fraction is primarily completely relaxed molecules or “balls,” which randomly populate the spotted areas. The average molecular length is 10 μm. (B) Sizing precision and accuracy. Restriction fragment sizing results for lambda bacteriophage DNA obtained by optical mapping plotted against sequence data. Fragment sizes range from 1,602 to 21,226 bp. Error bars represent SD of the means. Lambda DNA spotted on an APTES surface was digested with ApaLI, AvaI, BamHI, EagI, or EcoRI. Ten to 30 images were collected from one spot and analyzed by OMM.
Figure 4
Figure 4
Nick-translation labeling of fluid-fixed lambda bacteriophage DNA molecules using a fluorochrome-bearing nucleotide (R110-dUTP). DNA molecules fixed onto derivatized glass surfaces before labeling by nick-translation. (A) Overview of a spot (edge) using a 16× objective. (B) The same spot portion imaged with a 100× objective. (C) Counter-staining with YOYO3 (separate experiment). The absence of heavily punctated staining patterns along molecule backbones indicates the general absence of gaps, or double-strand breaks. Staining is not robust because of fluorochrome-fluorochrome interaction. (Bars: 4 μm.)

References

    1. Schwartz D C, Li X, Hernandez L I, Ramnarain S P, Huff E J, Wang Y K. Science. 1993;262:110–114. - PubMed
    1. Meng X, Benson K, Chada K, Huff E J, Schwartz D C. Nat Genet. 1995;9:432–438. - PubMed
    1. Cai W, Aburatani H, Stanton V P, Housman D E, Wang Y K, Schwartz D C. Proc Natl Acad Sci USA. 1995;92:5164–5168. - PMC - PubMed
    1. Cai W, Jing J, Irvin B, Ohler L, Rose E, Shizuya H, Kim U J, Simon M, Anantharaman T S, Mishra B, Schwartz D C. Proc Natl Acad Sci USA. 1998;95:3390–3395. - PMC - PubMed
    1. Schena M, Shalon D, Davis R W, Brown P O. Science. 1995;270:467–470. - PubMed

Publication types

LinkOut - more resources