. 1998 Jul 7;95(14):8075-80.
doi: 10.1073/pnas.95.14.8075.

ClC-5, the chloride channel mutated in Dent's disease, colocalizes with the proton pump in endocytotically active kidney cells

Affiliations

ClC-5, the chloride channel mutated in Dent's disease, colocalizes with the proton pump in endocytotically active kidney cells

W Günther et al. Proc Natl Acad Sci U S A. .

Abstract

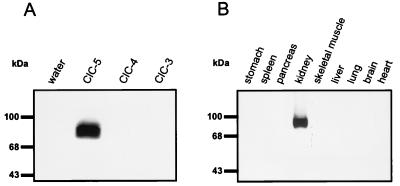
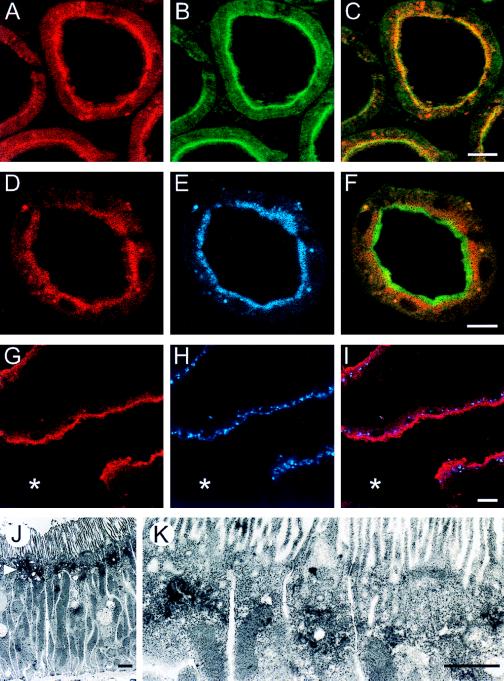
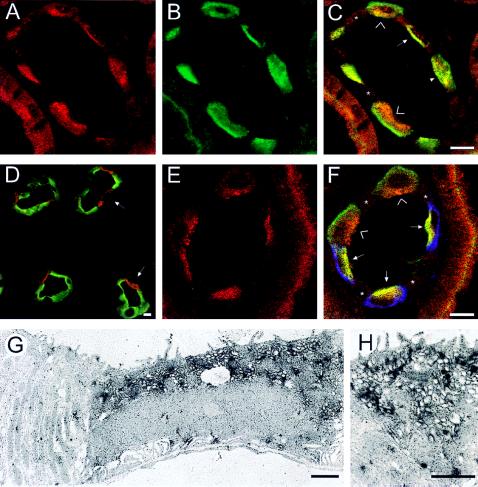
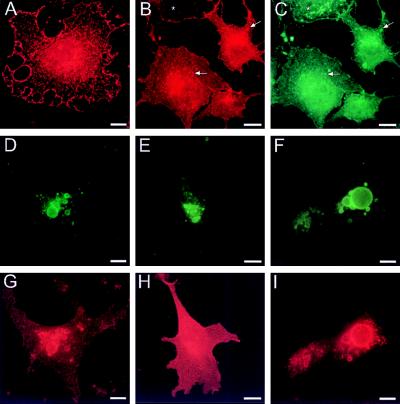
Loss-of-function mutations of the ClC-5 chloride channel lead to Dent's disease, a syndrome characterized by low molecular weight proteinuria, hypercalciuria, and kidney stones. We show that ClC-5 is expressed in renal proximal tubule cells, which normally endocytose proteins passing the glomerular filter. Expression is highest below the brush border in a region densely packed with endocytotic vesicles, where ClC-5 colocalizes with the H+-ATPase and with internalized proteins early after uptake. In intercalated cells of the collecting duct it again localizes to apical intracellular vesicles and colocalizes with the proton pump in alpha-intercalated cells. In transfected cells, ClC-5 colocalizes with endocytosed alpha2-macroglobulin. Cotransfection with a GTPase-deficient rab5 mutant leads to enlarged early endosomes that stain for ClC-5. We suggest that ClC-5 may be essential for proximal tubular endocytosis by providing an electrical shunt necessary for the efficient acidification of vesicles in the endocytotic pathway, explaining the proteinuria observed in Dent's disease.


Figures

Figure 1
Figure 1
Western blots of membranes from Xenopus oocytes expressing ClC-3, ClC-4, or ClC-5 (probed with PEP5A2) (A), and of crude membrane preparations from several rat organs (probed with PEP5E2) (B), demonstrating the specificity of the antibodies used in this work. Both sera specifically recognize a band of approximately 80 kDa in the kidney and in ClC-5-injected oocytes. This band corresponds to the predicted molecular mass of the ClC-5 chloride channel. The PEP5E2 antibody also recognized ClC-5 expressed in oocytes, and PEP5A2 recognizes the same band in kidney as the PEP5A2 antibody (not shown). On overexposure of additional blots (not shown), both antibodies also recognized a band in testis and faint bands in brain and liver. These tissues also express ClC-5 mRNA, albeit at a much lower level (4). All structures described in this study were observed with both antibodies, which were directed against two nonoverlapping epitopes, virtually excluding spurious results due to cross-reactivity.
Figure 2
Figure 2
Localization of the ClC-5 Cl channel in the proximal tubule of rat kidney by immunocytochemistry and laser scanning microscopy (A–I) or electron microscopy (J and K). (A–C) Cross section of several proximal tubules stained with the PEP5E2 antibody against ClC-5 (A) and with an antibody against the 70-kDa subunit of the H+-ATPase (B). Both proteins are concentrated in a “rim” beneath the apical surface. A and B are merged in C. (D–F) Proximal tubule from a rat injected with Cy5-labeled β2-microglobulin 2 min before fixation. The rim of ClC-5 expression (detected by PEP5E2 and shown in red in D and F) is located beneath the microvilli stained green with the anti-villin antibody in F. Low level expression of ClC-5 in other parts of the cell, including the brush border, cannot be excluded. The endocytosed protein shown in blue (E) largely overlaps with ClC-5 (D). (G–I) S1 segment of a proximal tubule immediately after its exit from the glomerular capsule (∗), from a rat injected with Cy5-labeled β2-microglobulin 13 min prior to fixation. As evident from the superimposed images (I), the reabsorbed protein (H) is generally deeper within the cells than the rim of maximal ClC-5 expression (detected with PEP5A2) (G). (J and K) Transmission electron micrographs showing the presence of ClC-5 (detected by PEP5E2 and peroxidase/diaminobenzidine) in a region rich in vesicles (indicated by the arrowhead) below the apical invaginations of the brush-border membrane. Two different proximal tubules are shown at different magnifications. (White bars indicate 10 μm; black bars, 1 μm.)
Figure 3
Figure 3
ClC-5 in the collecting duct. (A–C) Cross section through a cortical collecting duct and part of a proximal tubule (left). (A) Staining for ClC-5 by the PEP5A2 antibody. (B) Staining for the H+-ATPase by the E11 monoclonal antibody against the 31-kDa subunit. The two images are merged in C. The arrow indicates an α-IC (both proton pump and ClC-5 are apical), >s indicate β-ICs (pronounced basolateral H+-ATPase and diffuse to apical ClC-5), and the arrowhead indicates a cell with diffuse cytoplasmic staining for both ClC-5 and the proton pump. (D) Cross section through the medulla; staining for aquaporin 2 (green) identifies principal cells of the collecting duct; between these are ICs (arrows), which stain red with PEP5A2 for ClC-5. (E and F) Cross section through a cortical collecting duct and longitudinal section through a proximal tubule (right). (E) Detection of ClC-5 (by PEP5E2). (F) Costaining for ClC-5 (red), the H+-ATPase (green, by using the E11 monoclonal antibody), and the anion exchanger AE1 (blue). Costaining for ClC-5 and the H+-ATPase appears yellow. Arrows indicate α-ICs (basolateral AE1, proton pump and ClC-5 both apical); >s indicate β-ICs, which lack AE1, have predominantly basolateral H+-ATPase, and punctate apical staining for ClC-5. Asterisks (∗) indicate principal cells. (G and H) Transmission electron micrographs stained for ClC-5 (by PEPE2). In G, an IC with stained apical cytoplasmic vesicles is shown with an adjacent unstained principal cell (left). (H) Higher magnification of the apical region of a different IC. (White bars, 10 μm; black bars, 1 μm.)
Figure 4
Figure 4
ClC-5 in transfected cells. COS-7 (A–E, G, and H) or MDCK (F and I) cells were transfected with ClC-5 (A–D, F, G, and I), or, as a control, with ClC-0 (E and H). ClC-5 (detected by PEP5A2) is expressed in vesicles throughout the cytoplasm and in a punctate pattern at the plasma membrane (A and B). Cells in B and C were allowed to endocytose α2-macroglobulin and examined in double-immunofluorescence for ClC-5 (red) (B) and α2-macroglobulin (green) (C). There is a large degree of colocalization as indicated by arrows for some arbitrarily chosen vesicles. A cell not transfected with ClC-5 (∗) has also internalized α2-macroglobulin. Cells in D–I were cotransfected with the GTPase-deficient rab5 mutant Q79L tagged with a myc epitope. Staining for this epitope (green) (D–F) reveals large vesicles representing enlarged early endosomes. These costain for ClC-5 both in COS-7 cells (G) and in MDCK cells that have been grown to an epithelial layer (I). In contrast, when cotransfected with the homologous ClC-0 channel (E and H), ClC-0 is excluded from these vesicles (stained for rab5 in E) and stays in the plasma membrane (as detected with the T12 antibody and shown in red in H). (Bars = 10 μm.)

References

    1. Wrong O M, Norden A G W, Fest T G. Q J Med. 1994;87:473–493. - PubMed
    1. Lloyd S E, Pearce S H, Fisher S E, Steinmeyer K, Schwappach B, Scheinman S J, Harding B, Bolino A, Devoto M, Goodyer P, et al. Nature (London) 1996;379:445–449. - PubMed
    1. Fisher S E, Black G C, Lloyd S E, Hatchwell E, Wrong O, Thakker R V, Craig I W. Hum Mol Genet. 1994;3:2053–2059. - PubMed
    1. Steinmeyer K, Schwappach B, Bens M, Vandewalle A, Jentsch T J. J Biol Chem. 1995;270:31172–31177. - PubMed
    1. Jentsch T J, Günther W, Pusch M, Schwappach B. J Physiol (London) 1995;482:19S–25S. - PMC - PubMed

Publication types

LinkOut - more resources