. 1998 Jul 7;95(14):8392-7.
doi: 10.1073/pnas.95.14.8392.

Low-temperature carbon utilization is regulated by novel gene activity in the heart of a hibernating mammal

Affiliations

Low-temperature carbon utilization is regulated by novel gene activity in the heart of a hibernating mammal

M T Andrews et al. Proc Natl Acad Sci U S A. .

Abstract

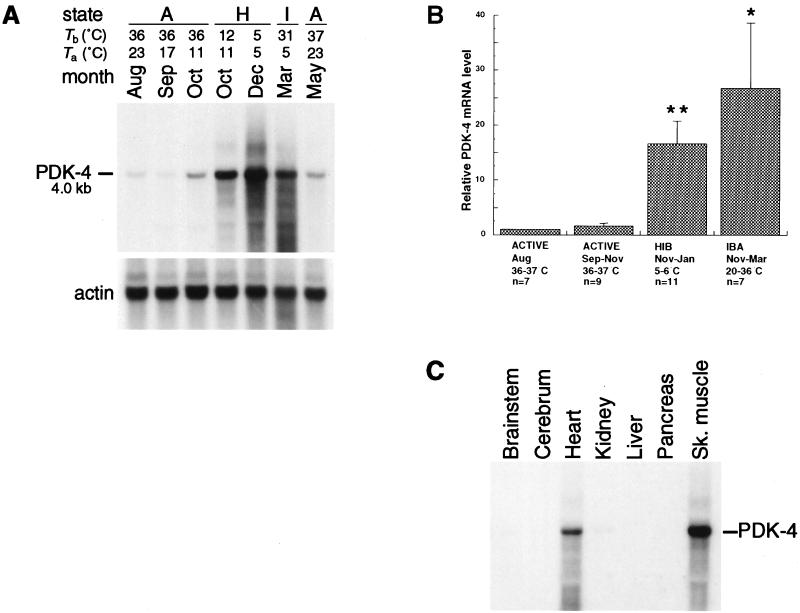
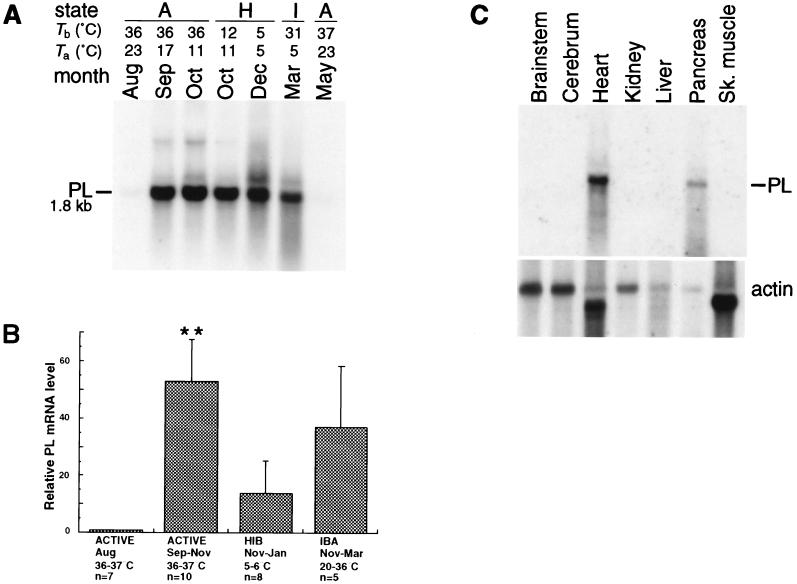
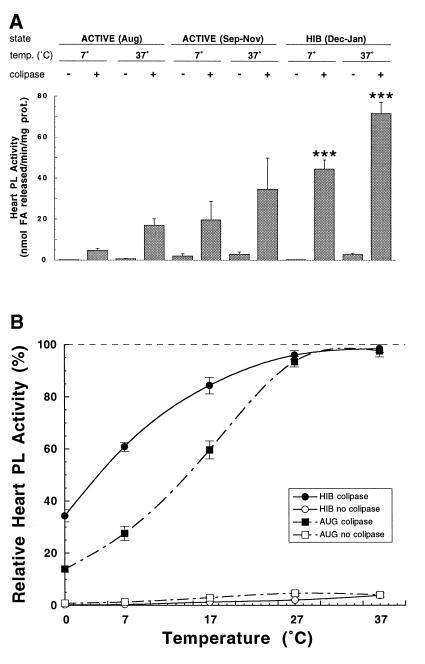
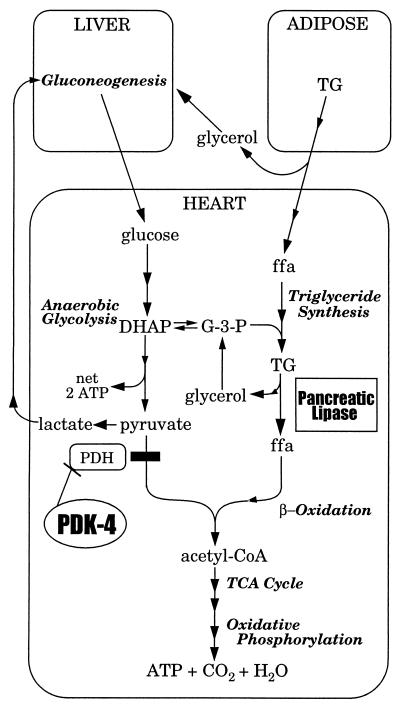
Hibernation is a physiological adaptation characterized by dramatic decreases in heart rate, body temperature, and metabolism, resulting in long-term dormancy. Hibernating mammals survive for periods up to 6 mo in the absence of food by minimizing carbohydrate catabolism and using triglyceride stores as their primary source of fuel. The cellular and molecular mechanisms underlying the changes from a state of activity to the hibernating state are poorly understood; however, the selective expression of genes offers one level of control. To address this problem, we used a differential gene expression screen to identify genes that are responsible for the physiological characteristics of hibernation in the heart of the thirteen-lined ground squirrel (Spermophilus tridecemlineatus). Here, we report that genes for pancreatic lipase and pyruvate dehydrogenase kinase isozyme 4 are up-regulated in the heart during hibernation. Pancreatic lipase is normally expressed exclusively in the pancreas, but when expressed in the hibernating heart it liberates fatty acids from triglycerides at temperatures as low as 0 degreesC. Pyruvate dehydrogenase kinase isozyme 4 inhibits carbohydrate oxidation and depresses metabolism by preventing the conversion of pyruvate to Ac-CoA. The resulting anaerobic glycolysis and low-temperature lipid catabolism provide evidence that adaptive changes in cardiac physiology are controlled by the differential expression of genes during hibernation.


Figures

Figure 1
Figure 1
Expression of PDK-4 during the hibernation season. (A) Northern blot of total RNA from the hearts of active and hibernating 13-lined ground squirrels. The position and size of PDK-4 mRNA are indicated. Body temperature (Tb), ambient temperature (Ta), and month of sacrifice are indicated above each lane. The state of each animal is indicated as active (A), hibernating (H), or in interbout arousal (I). The actin profile is shown directly below. August through October animals and December through May animals represent two separate sibling groups from mothers captured in Michigan. (B) Bar graph summarizing PDK-4 mRNA levels in the hearts of sibling and nonsibling ground squirrels captured in Michigan and Illinois (TLS Research, Bartlett, IL). PDK-4 mRNA levels were quantified by a PhosphorImager (Molecular Dynamics). For each experiment the PDK-4 value for the August animal was normalized to 1.00. Each bar represents mean values derived from RNA blot experiments (±SEM). Body temperature, state, month(s) of sacrifice, and the number of animals (n) are indicated below each group. HIB, hibernating; IBA, interbout arousal. Statistically significant comparisons to August mRNA levels were determined by one-way ANOVA: ∗, 0.01 < P < 0.05; ∗∗, P ≤ 0.01. (C) Tissue distribution of PDK-4 mRNA from a single hibernating animal sacrificed in January during hypothermic torpor (Tb = 5°C). Tissues are as indicated above each lane and the actin profile for this blot is shown in Fig. 2C. Sk. muscle, skeletal muscle.
Figure 2
Figure 2
Expression of PL during the hibernation season. (A) The position and size of heart PL mRNA are indicated. The RNA blot and its actin profile are the same as the one shown in Fig. 1A. (B) Bar graph summarizing PL mRNA levels in the hearts of sibling and nonsibling squirrels captured in Michigan and Illinois. PL mRNA levels were quantified by a PhosphorImager. For each experiment the PL value for the August animal was normalized to 1.00. Each bar represents mean values derived from RNA blot experiments (±SEM). Body temperature, state, month(s) of sacrifice, and the number of animals (n) are indicated below each group. HIB, hibernating; IBA, interbout arousal. Statistically significant comparisons to August mRNA levels were determined by one-way ANOVA: ∗∗, P ≤ 0.01. (C) Tissue distribution of PL mRNA using same blot as shown in Fig. 1C. Tissues are as indicated above each lane and the actin profile for this blot is shown directly below. Sk. muscle, skeletal muscle.
Figure 3
Figure 3
Heart PL activity determinations in vitro at various temperatures. (A) Mean heart PL activity (±SEM) at the indicated assay temperatures from five summer-active (ACTIVE, August, Tb = 36–37°C), five fall-active (ACTIVE, September–November, Tb = 36–37°C), or five hibernating (HIB, December–January; Tb = 5–7°C) ground squirrels with (+) or without (−) PL-specific activator colipase. Statistically significant comparisons to respective August PL activity were determined by one-way ANOVA: ∗∗∗, P = 0.0001. (B) Mean relative percentage of heart PL activity of five summer-active (AUG, August,; Tb = 36–37°C) or five hibernating (HIB, December–January, Tb = 5–7°C) animals at assay temperatures of 0, 7, 17, 27, and 37°C. For each individual animal the assay temperature showing the highest activity was designated as 100%. Open symbols represent mean percentage of activity in the absence of colipase and closed symbols represent mean percentage of activity with colipase. Bars flanking each point represent ±SEM. Mean relative percentage of HIB PL activity in the presence of colipase is significantly different from that of percentage of AUG PL activity as determined by one-way ANOVA at P = 0.0001 for 0 and 7°C, and P = 0.0007 for 17°C.
Figure 4
Figure 4
Model showing the metabolic involvement of PDK-4 and PL in the heart of a hibernating 13-lined ground squirrel. Names of metabolic pathways are shown in italics. Arrows with a single arrowhead indicate a single reaction. Continuous arrows with two or more arrowheads indicate multistep pathways. DHAP, dihydroxyacetone phosphate; ffa, free fatty acid; G-3-P, l-glycerol 3-phosphate; PDH, pyruvate dehydrogenase; TCA cycle, tricarboxylic acid cycle; TG, triglyceride.

References

    1. Adolph E F. Am J Physiol. 1951;166:75–91. - PubMed
    1. Lyman C P, Willis J S, Malan A, Wang L C H. Hibernation and Torpor in Mammals and Birds. New York: Academic; 1982.
    1. Hochachka P W. Science. 1986;231:234–241. - PubMed
    1. Wang Z, Brown D D. Proc Natl Acad Sci USA. 1991;88:11505–11509. - PMC - PubMed
    1. Srere H K, Wang L C, Martin S L. Proc Natl Acad Sci USA. 1992;89:7119–7123. - PMC - PubMed

Publication types

Associated data

LinkOut - more resources