

Apoptosis induction by the binding of the carboxyl terminus of human immunodeficiency virus type 1 gp160 to calmodulin
- PMID: 9658102
- PMCID: PMC109834
- DOI: 10.1128/JVI.72.8.6574-6580.1998
Apoptosis induction by the binding of the carboxyl terminus of human immunodeficiency virus type 1 gp160 to calmodulin
Abstract
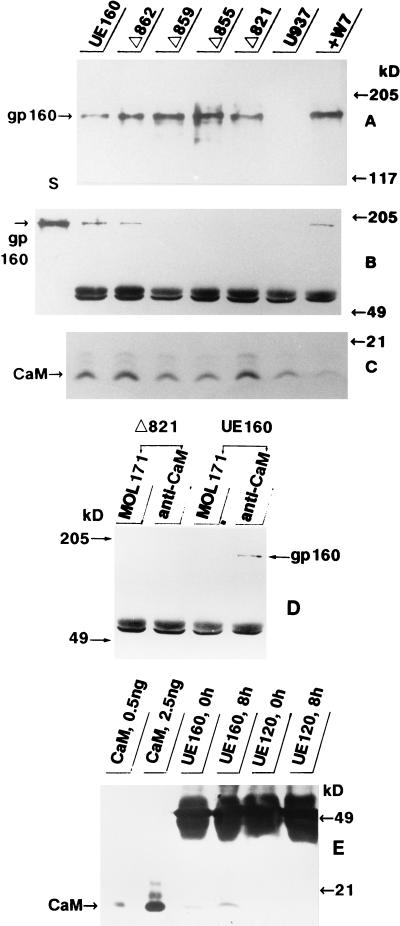
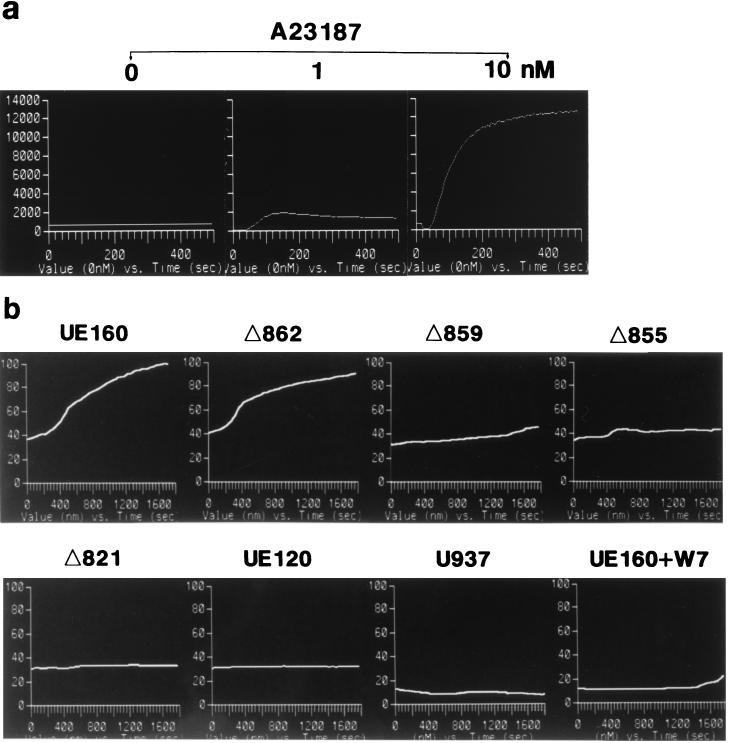
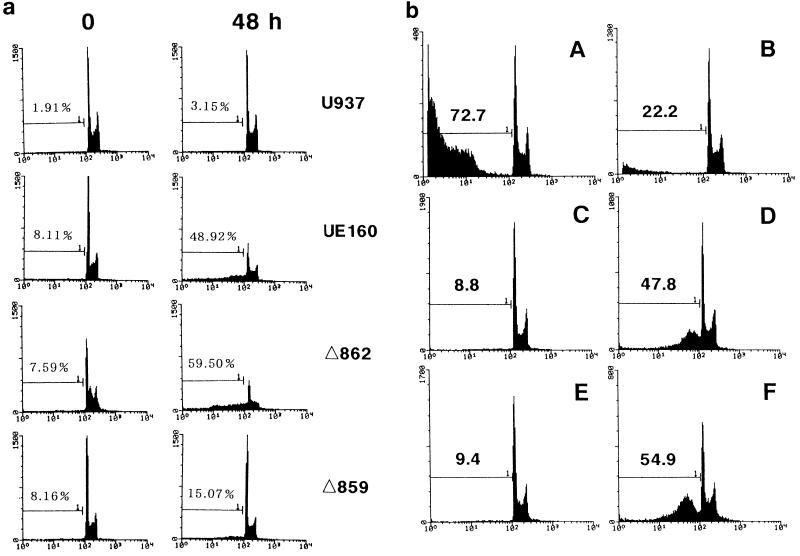
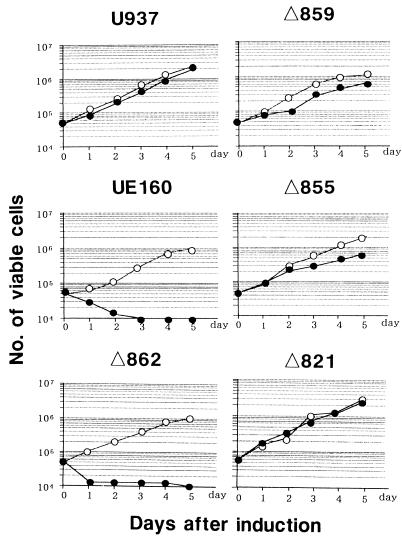
The role of calmodulin (CaM) in apoptosis induced by gp160 of human immunodeficiency virus type 1 was investigated with cells undergoing single-cell killing. These cells were found to express, under the control of an inducible promoter, wild-type gp160 or mutant gp160 devoid of various lengths of the carboxyl terminus. Immunoprecipitation accompanied by immunoblotting revealed binding of CaM to wild-type gp160 but not to mutant gp160 bearing a carboxyl terminus with a deletion spanning more than five amino acid residues. A significant coenzyme activity was detected in the CaM bound to gp160 even in the presence of a Ca2+ chelater, EGTA. The cells forming this gp160-CaM complex exhibited an elevated intracellular Ca2+ level followed by DNA fragmentation, which is a hallmark of apoptosis, and finally cell killing, while the cells not forming this complex did not show any significant elevation in Ca2+ level or DNA fragmentation. These results thus indicated that CaM plays a key role in gp160-induced apoptosis.
Figures

Similar articles
-
Point mutations in the C-terminus of HIV-1 gp160 reduce apoptosis and calmodulin binding without affecting viral replication.Virology. 2006 Jan 20;344(2):468-79. doi: 10.1016/j.virol.2005.08.033. Epub 2005 Oct 17. Virology. 2006. PMID: 16229872 Free PMC article.
-
Requirement of calmodulin binding by HIV-1 gp160 for enhanced FAS-mediated apoptosis.J Biol Chem. 2000 Jan 14;275(2):1233-40. doi: 10.1074/jbc.275.2.1233. J Biol Chem. 2000. PMID: 10625668
-
Induction of apoptosis by calmodulin-dependent intracellular Ca2+ elevation in CD4+ cells expressing gp 160 of HIV.Virology. 1996 Oct 1;224(1):18-24. doi: 10.1006/viro.1996.0502. Virology. 1996. PMID: 8862395
-
[The role of env in HIV-mediated apoptosis].Uirusu. 1997 Jun;47(1):99-107. doi: 10.2222/jsv.47.99. Uirusu. 1997. PMID: 9290319 Review. Japanese. No abstract available.
-
Role of CD4 receptor down-regulation during HIV-1 infection.Curr HIV Res. 2004 Jan;2(1):51-9. doi: 10.2174/1570162043485086. Curr HIV Res. 2004. PMID: 15053340 Review.
Cited by
-
The frantic play of the concealed HIV envelope cytoplasmic tail.Retrovirology. 2013 May 24;10:54. doi: 10.1186/1742-4690-10-54. Retrovirology. 2013. PMID: 23705972 Free PMC article. Review.
-
Regulation of human immunodeficiency virus type 1 envelope glycoprotein fusion by a membrane-interactive domain in the gp41 cytoplasmic tail.J Virol. 2005 Oct;79(19):12231-41. doi: 10.1128/JVI.79.19.12231-12241.2005. J Virol. 2005. PMID: 16160149 Free PMC article.
-
Point mutations in the C-terminus of HIV-1 gp160 reduce apoptosis and calmodulin binding without affecting viral replication.Virology. 2006 Jan 20;344(2):468-79. doi: 10.1016/j.virol.2005.08.033. Epub 2005 Oct 17. Virology. 2006. PMID: 16229872 Free PMC article.
-
Cell-dependent requirement of human immunodeficiency virus type 1 gp41 cytoplasmic tail for Env incorporation into virions.J Virol. 2000 May;74(10):4891-3. doi: 10.1128/jvi.74.10.4891-4893.2000. J Virol. 2000. PMID: 10775630 Free PMC article.
-
The tale of the long tail: the cytoplasmic domain of HIV-1 gp41.J Virol. 2013 Jan;87(1):2-15. doi: 10.1128/JVI.02053-12. Epub 2012 Oct 17. J Virol. 2013. PMID: 23077317 Free PMC article. Review.
References
-
- Asjo B, Ivhed I, Gidlund M, Fuerstenberg S, Fenyo E M, Nilsson K, Wigzell H. Susceptibility to infection by the human immunodeficiency virus correlates with T4 expression in a parental monocytoid cell line and its subclones. Virology. 1987;157:359–365. - PubMed
-
- Cox J A, Comte M, Fitton J E, Degrado W F. The interaction of calmodulin with amphiphilic peptides. J Biol Chem. 1985;260:2527–2534. - PubMed
MeSH terms
Substances
LinkOut - more resources
Full Text Sources
Miscellaneous
