

Actinomycin D inhibits human immunodeficiency virus type 1 minus-strand transfer in in vitro and endogenous reverse transcriptase assays
- PMID: 9658119
- PMCID: PMC109878
- DOI: 10.1128/JVI.72.8.6716-6724.1998
Actinomycin D inhibits human immunodeficiency virus type 1 minus-strand transfer in in vitro and endogenous reverse transcriptase assays
Abstract
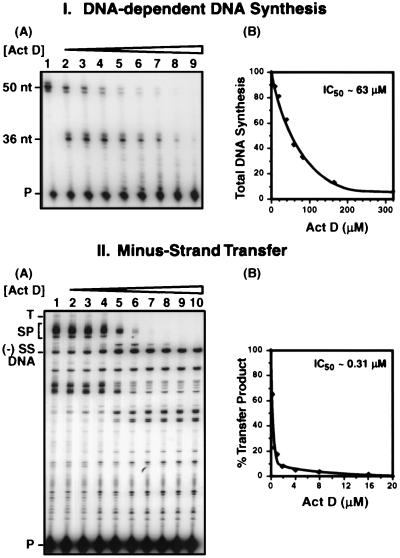
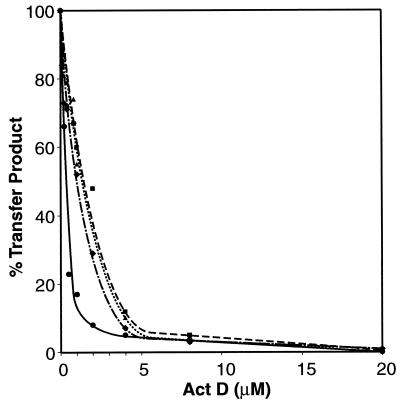
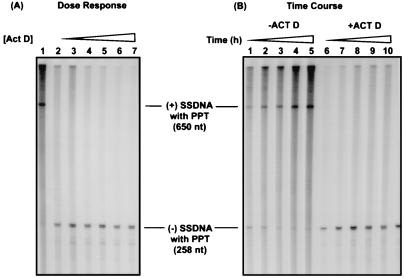
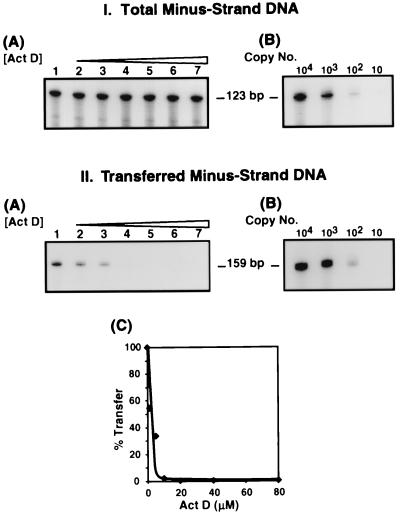
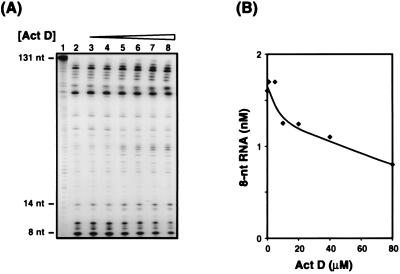
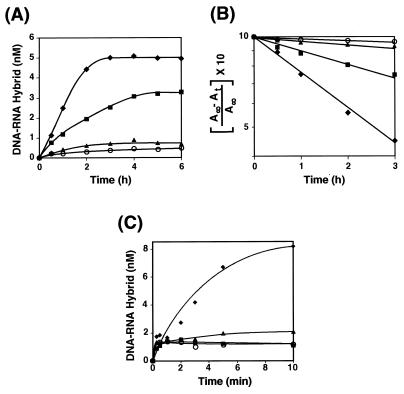
In this report we demonstrate that human immunodeficiency virus type 1 (HIV-1) minus-strand transfer, assayed in vitro and in endogenous reactions, is greatly inhibited by actinomycin D. Previously we showed that HIV-1 nucleocapsid (NC) protein (a nucleic acid chaperone catalyzing nucleic acid rearrangements which lead to more thermodynamically stable conformations) dramatically stimulates HIV-1 minus-strand transfer by preventing TAR-dependent self-priming from minus-strand strong-stop DNA [(-) SSDNA]. Despite this potent activity, the addition of NC to in vitro reactions with actinomycin D results in only a modest increase in the 50% inhibitory concentration (IC50) for the drug. PCR analysis of HIV-1 endogenous reactions indicates that minus-strand transfer is inhibited by the drug with an IC50 similar to that observed when NC is present in the in vitro system. Taken together, these results demonstrate that NC cannot overcome the inhibitory effect of actinomycin D on minus-strand transfer. Other experiments reveal that at actinomycin D concentrations which severely curtail minus-strand transfer, neither the synthesis of (-) SSDNA nor RNase H degradation of donor RNA is affected; however, the annealing of (-) SSDNA to acceptor RNA is significantly reduced. Thus, inhibition of the annealing reaction is responsible for actinomycin D-mediated inhibition of strand transfer. Since NC (but not reverse transcriptase) is required for efficient annealing, we conclude that actinomycin D inhibits minus-strand transfer by blocking the nucleic acid chaperone activity of NC. Our findings also suggest that actinomycin D, already approved for treatment of certain tumors, might be useful in combination therapy for AIDS.
Figures
Similar articles
-
Actinomycin D inhibition of DNA strand transfer reactions catalyzed by HIV-1 reverse transcriptase and nucleocapsid protein.Biochemistry. 1998 Oct 6;37(40):14213-21. doi: 10.1021/bi9814890. Biochemistry. 1998. PMID: 9760259
-
Effects of nucleic acid local structure and magnesium ions on minus-strand transfer mediated by the nucleic acid chaperone activity of HIV-1 nucleocapsid protein.Nucleic Acids Res. 2007;35(12):3974-87. doi: 10.1093/nar/gkm375. Epub 2007 Jun 6. Nucleic Acids Res. 2007. PMID: 17553835 Free PMC article.
-
Human immunodeficiency virus type 1 nucleocapsid protein promotes efficient strand transfer and specific viral DNA synthesis by inhibiting TAR-dependent self-priming from minus-strand strong-stop DNA.J Virol. 1997 Jul;71(7):5178-88. doi: 10.1128/JVI.71.7.5178-5188.1997. J Virol. 1997. PMID: 9188585 Free PMC article.
-
Strand transfer events during HIV-1 reverse transcription.Virus Res. 2008 Jun;134(1-2):19-38. doi: 10.1016/j.virusres.2007.12.017. Epub 2008 Feb 14. Virus Res. 2008. PMID: 18279992 Review.
-
Requirements for efficient minus strand strong-stop DNA transfer in human immunodeficiency virus 1.RNA Biol. 2011 Mar-Apr;8(2):230-6. doi: 10.4161/rna.8.2.14802. Epub 2011 Mar 1. RNA Biol. 2011. PMID: 21444998 Free PMC article. Review.
Cited by
-
Molecular requirements for human immunodeficiency virus type 1 plus-strand transfer: analysis in reconstituted and endogenous reverse transcription systems.J Virol. 1999 Jun;73(6):4794-805. doi: 10.1128/JVI.73.6.4794-4805.1999. J Virol. 1999. PMID: 10233940 Free PMC article.
-
Zinc finger structures in the human immunodeficiency virus type 1 nucleocapsid protein facilitate efficient minus- and plus-strand transfer.J Virol. 2000 Oct;74(19):8980-8. doi: 10.1128/jvi.74.19.8980-8988.2000. J Virol. 2000. PMID: 10982342 Free PMC article.
-
Structural Insights into the HIV-1 Minus-strand Strong-stop DNA.J Biol Chem. 2016 Feb 12;291(7):3468-82. doi: 10.1074/jbc.M115.708099. Epub 2015 Dec 14. J Biol Chem. 2016. PMID: 26668324 Free PMC article.
-
Comprehensive comparative analysis of strand-specific RNA sequencing methods.Nat Methods. 2010 Sep;7(9):709-15. doi: 10.1038/nmeth.1491. Epub 2010 Aug 15. Nat Methods. 2010. PMID: 20711195 Free PMC article.
-
Retroviral nucleocapsid proteins and DNA strand transfers.Biochim Open. 2018 Jul 20;7:10-25. doi: 10.1016/j.biopen.2018.07.001. eCollection 2018 Dec. Biochim Open. 2018. PMID: 30109196 Free PMC article. Review.
References
-
- Bader J P. The role of deoxyribonucleic acid in the synthesis of Rous sarcoma virus. Virology. 1964;22:462–468. - PubMed
-
- Bailey S A, Graves D E, Rill R. Binding of actinomycin D to the T(G)nT motif of double-stranded DNA: determination of the guanine requirement in nonclassical, non-GpC binding sites. Biochemistry. 1994;33:11493–11500. - PubMed
-
- Baltimore D. RNA-dependent DNA polymerase in virions of RNA tumour viruses. Nature. 1970;226:1209–1211. - PubMed
Publication types
MeSH terms
Substances
LinkOut - more resources
Full Text Sources
Medical
