. 1998 Jul 13;142(1):69-84.
doi: 10.1083/jcb.142.1.69.

Distribution of a glycosylphosphatidylinositol-anchored protein at the apical surface of MDCK cells examined at a resolution of <100 A using imaging fluorescence resonance energy transfer

Affiliations

Distribution of a glycosylphosphatidylinositol-anchored protein at the apical surface of MDCK cells examined at a resolution of <100 A using imaging fluorescence resonance energy transfer

A K Kenworthy et al. J Cell Biol. .

Erratum in

  • J Cell Biol 1998 Aug 10;142(3):following 881

Abstract

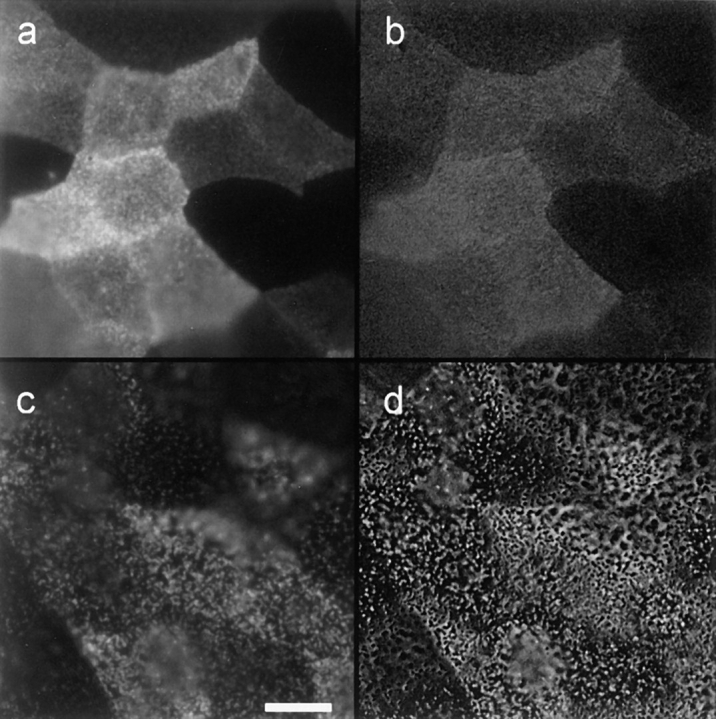
Membrane microdomains ("lipid rafts") enriched in glycosylphosphatidylinositol (GPI)-anchored proteins, glycosphingolipids, and cholesterol have been implicated in events ranging from membrane trafficking to signal transduction. Although there is biochemical evidence for such membrane microdomains, they have not been visualized by light or electron microscopy. To probe for microdomains enriched in GPI- anchored proteins in intact cell membranes, we used a novel form of digital microscopy, imaging fluorescence resonance energy transfer (FRET), which extends the resolution of fluorescence microscopy to the molecular level (<100 A). We detected significant energy transfer between donor- and acceptor-labeled antibodies against the GPI-anchored protein 5' nucleotidase (5' NT) at the apical membrane of MDCK cells. The efficiency of energy transfer correlated strongly with the surface density of the acceptor-labeled antibody. The FRET data conformed to theoretical predictions for two-dimensional FRET between randomly distributed molecules and were inconsistent with a model in which 5' NT is constitutively clustered. Though we cannot completely exclude the possibility that some 5' NT is in clusters, the data imply that most 5' NT molecules are randomly distributed across the apical surface of MDCK cells. These findings constrain current models for lipid rafts and the membrane organization of GPI-anchored proteins.


Figures

Figure A1
Figure A1
Schematic depiction of how surface density of proteins and D:A differently influence FRET for randomly distributed (a–c) and clustered (d–f) molecules on a membrane. For simplicity, “clustered” molecules are modeled as the minimal form of clusters, dimers. The molecules of interest are either unlabeled (open circles) or labeled with donor (gray circles) or acceptor (black circles) to yield the indicated D:A. For each condition, the area of the membrane examined (box) is held constant, and the surface density is varied by changing the number N of molecules per box. The size of the molecules of interest determines the scale of the model. For instance, if we assume a particle diameter of 5 nm (50 Å), then the box size is 70 × 70 nm. The arrows in c and d indicate a donor and acceptor pair that are in close enough proximity for energy transfer to occur at this scale, and the arrowheads point to a donor and acceptor pair that are too far apart for energy transfer to occur. Note that because we only show a limited number of molecules, these models are not statistically accurate. For example, the apparent E clustered for the model in f is 50%, but for an experimental population labeled at this D:A, E clustered would be 37.5%, as described in the text.
Figure 1
Figure 1
Energy transfer can be detected from the increase in donor fluorescence after acceptor photobleaching. (a) Donor (Cy3) image before acceptor photobleaching, (b) acceptor (Cy5) image before photobleaching, (c) donor (Cy3) image after acceptor (Cy5) photobleaching, and (d) acceptor (Cy5) image after photobleaching. In this experiment, the cells were labeled with donor- and acceptor-conjugated IgG at D:A of 1:3. Bar, 10 μm.
Figure A2
Figure A2
Theoretical dependence of energy transfer efficiency E random on acceptor surface density, r, and R o for randomly distributed donors and acceptors in a membrane. The acceptor surface density is represented by the dimensionless parameter c A. Theoretical curves were calculated using the third approximant of Dewey and Hammes (1980) for r = 1.5R o and 2R o or Eq. A1 (Wolber and Hudson, 1979) for r = 0 and R o, as indicated on the figure.
Figure A3
Figure A3
Model calculations for energy transfer efficiency E mixture arising from mixtures of randomly distributed and clustered molecules. The acceptor surface density is represented by the dimensionless parameter c A. (a) Effect of constant mole fraction of clustered molecules (f clustered) in the mixture. Model curves were calculated from Eq. A5, setting r = R o, E clustered = 37.5%, and assuming f clustered is either 0.1 (squares) or 0.5 (triangles). E random for a pure random population was calculated with Eq. A1 assuming r = R o (solid circles). (b) Effect of varying D:A. Model curves were calculated from Eq. A5 with r = R o and f random = f clustered = 0.5. E clustered was calculated using Eq. A4, assuming E dimer = 50%, for D:A = 1:1 (squares), 1:2 (triangles), or 1:3 (diamonds). To match the experimental labeling conditions, the calculations of f A at the various D:A assume that the concentration of D in the mixture is 25% of the saturating concentration, therefore f A = 0.25 at D:A = 1:1, 0.5 at 1:2, and 0.75 at 1:3. (c) Effect of surface density– dependent clustering, for randomly distributed donors that each can bind one acceptor (to form a heterodimer). Model curves were calculated from Eq. A5 setting r = R o, E clustered = 50%, and f clustered = c A /c D, assuming c D = 0.3 (triangles) or 0.5 (squares). E random for a pure random population was calculated with Eq. A1 assuming r = R o (solid circles).
Figure 2
Figure 2
E increases with increasing 5′ NT surface densities. (a) E image calculated from the donor images in Fig. 1 using Eq. 2. The bar indicates the scale for the E. (b) Graph of E (%) versus acceptor fluorescence intensity. Each datum represents the mean E and acceptor fluorescence value obtained for a 40 × 40-pixel square region of interest on an individual cell (as described in the Materials and Methods) for the cells in a plus three additional fields of cells.
Figure 2
Figure 2
E increases with increasing 5′ NT surface densities. (a) E image calculated from the donor images in Fig. 1 using Eq. 2. The bar indicates the scale for the E. (b) Graph of E (%) versus acceptor fluorescence intensity. Each datum represents the mean E and acceptor fluorescence value obtained for a 40 × 40-pixel square region of interest on an individual cell (as described in the Materials and Methods) for the cells in a plus three additional fields of cells.
Figure 3
Figure 3
E depends on acceptor surface density and is insensitive to D:A, in the regime of low donor surface density, for cells labeled with donor- and acceptor-conjugated IgG. (a) E as a function of the donor fluorescence, for D:A of 1:0.5 (circles), 1:1 (squares), 1:2 (triangles), or 1:5 (diamonds). (b) E as a function of the acceptor fluorescence, for D:A of 1:0.5 (circles), 1:1 (squares), 1:2 (triangles) or 1:5 (diamonds). (c) E as a function of acceptor fluorescence, for D:A of 0.5:1 (triangles), 1:1 (circles), or 5:1 (squares). Note that in this experiment, the acceptor concentration, rather than the donor concentration, was held constant.
Figure 4
Figure 4
E depends on acceptor surface density for cells labeled with donor- and acceptor-conjugated Fab. (a) E as a function of the donor fluorescence, for D:A of 1:0 (circles), 1:1 (squares), 1:2 (triangles), 1:3 (diamonds), or 1:4 (inverted triangles). (b) E as a function of the acceptor fluorescence, for D:A of 1:1 (squares), 1:2 (triangles), 1:3 (diamonds), or 1:4 (inverted triangles).
Figure 6
Figure 6
Positive control for “clustered” donors and acceptors: energy transfer between donor-labeled primary antibodies and acceptor-labeled secondary antibodies. Uninduced cells were labeled either with 1:1 D:A (IgG) as in previous experiments (closed circles) or with 50 μg/ml of Cy3 anti–5′ NT IgG for 15 min at 4°C, washed, and then labeled for 15 min at 4°C with either 5 μg/ml (squares) or 50 μg/ml (triangles) Cy5-labeled donkey anti– mouse IgG, washed, and then fixed as previously described.
Figure 7
Figure 7
Energy transfer between anti–5′ NT antibodies is enhanced by antibody-induced cross-linking. Acceptor fluorescence images (a and c) and E images (b and d) of uninduced cells (expressing low levels of 5′ NT) labeled with 1:1 D:A (IgG) followed by an incubation in the absence (a and b) or presence (c and d) of 10 μg/ml unlabeled secondary antibody. (e) E as a function of acceptor fluorescence for cells labeled with 1:1 D:A (IgG) in the presence (open squares) or absence (closed circles) of secondary antibody. Bar, 10 μm.
Figure 7
Figure 7
Energy transfer between anti–5′ NT antibodies is enhanced by antibody-induced cross-linking. Acceptor fluorescence images (a and c) and E images (b and d) of uninduced cells (expressing low levels of 5′ NT) labeled with 1:1 D:A (IgG) followed by an incubation in the absence (a and b) or presence (c and d) of 10 μg/ml unlabeled secondary antibody. (e) E as a function of acceptor fluorescence for cells labeled with 1:1 D:A (IgG) in the presence (open squares) or absence (closed circles) of secondary antibody. Bar, 10 μm.
Figure 5
Figure 5
Experimental energy transfer efficiencies are similar to those predicted for randomly distributed donors and acceptors when plotted as a function of absolute acceptor surface density. (a) Data from the experiment in Fig. 2 plotted in terms of absolute acceptor-labeled antibody surface density, estimated using fluorescent calibration standards as described in the Materials and Methods, for D:A of 1:1 (circles), 1:2 (squares), and 1:3 (triangles). (b) Theoretical curves from Fig. A2 were replotted in terms of absolute acceptor surface densities, assuming R o = 50 Å. Curves were calculated using the third approximant of Dewey and Hammes (1980) for 1.5R o and 2R o or Eq. A1 (Wolber and Hudson, 1979) for r = 0 and r = R o.
Figure 8
Figure 8
Energy transfer between anti–5′ NT antibodies is enhanced by Triton X-100 extraction of cells. Acceptor fluorescence images (a and c) and E images (b and d) of cells induced to express high levels of 5′ NT, labeled with 1:1 D:A (Fab) followed by a 30-min incubation at 4°C in PBS++ (a and b) or PBS++ containing 1% Triton X-100 before fixation (c and d). The arrow in c points to a hole in the membrane, formed by the Triton X-100 extraction procedure. (e) E as a function of acceptor fluorescence for cells incubated in the presence (open squares) or absence (closed circles) of 1% Triton X-100. Bar, 10 μm.
Figure 8
Figure 8
Energy transfer between anti–5′ NT antibodies is enhanced by Triton X-100 extraction of cells. Acceptor fluorescence images (a and c) and E images (b and d) of cells induced to express high levels of 5′ NT, labeled with 1:1 D:A (Fab) followed by a 30-min incubation at 4°C in PBS++ (a and b) or PBS++ containing 1% Triton X-100 before fixation (c and d). The arrow in c points to a hole in the membrane, formed by the Triton X-100 extraction procedure. (e) E as a function of acceptor fluorescence for cells incubated in the presence (open squares) or absence (closed circles) of 1% Triton X-100. Bar, 10 μm.

Similar articles

Cited by

References

    1. Adair BD, Engelman DM. Glycophorin A helical transmembrane domains dimerize in phospholipid bilayers: a resonance energy transfer study. Biochemistry. 1994;33:5539–5544. - PubMed
    1. Adams SR, Harootunian AT, Buechler YJ, Taylor SS, Tsien RY. Fluorescence ratio imaging of cyclic AMP in single cells. Nature. 1991;349:694–697. - PubMed
    1. Ahmed SN, Brown DA, London E. On the origin of sphingolipid/ cholesterol-rich detergent-insoluble cell membranes: physiological concentrations of cholesterol and sphingolipid induce formation of a detergent- insoluble, liquid-ordered lipid phase in model membranes. Biochemistry. 1997;36:10944–10953. - PubMed
    1. Airas L, Niemela J, Salmi M, Puurunen T, Smith DJ, Jalkanen S. Differential regulation and function of CD73, a glycosyl-phosphatidylinositol-linked 70-kD adhesion molecules, on lymphocytes and endothelial cells. J Cell Biol. 1997;136:421–431. - PMC - PubMed
    1. Arreaza G, Melkonian KA, LaFevre-Bernt M, Brown DA. Triton X-100-resistant membrane complexes from cultured kidney epithelial cells contain the Src family protein tyrosine kinase p62yes. J Biol Chem. 1994;269:19123–19127. - PubMed

Publication types