. 1998 Jul 13;142(1):153-65.
doi: 10.1083/jcb.142.1.153.

Functional specialization of stable and dynamic microtubules in protein traffic in WIF-B cells

Affiliations

Functional specialization of stable and dynamic microtubules in protein traffic in WIF-B cells

C Poüs et al. J Cell Biol. .

Abstract

We found that the magnesium salt of ilimaquinone, named 201-F, specifically disassembled dynamically unstable microtubules in fibroblasts and various epithelial cell lines. Unlike classical tubulin- interacting drugs such as nocodazole or colchicine which affect all classes of microtubules, 201-F did not depolymerize stable microtubules. In WIF-B-polarized hepatic cells, 201-F disrupted the Golgi complex and inhibited albumin and alpha1-antitrypsin secretion to the same extent as nocodazole. By contrast, 201-F did not impair the transport of membrane proteins to the basolateral surface, which was only affected by the total disassembly of cellular microtubules. Transcytosis of two apical membrane proteins-the alkaline phosphodiesterase B10 and dipeptidyl peptidase IV-was affected to the same extent by 201-F and nocodazole. Taken together, these results indicate that only dynamically unstable microtubules are involved in the transport of secretory proteins to the plasma membrane, and in the transcytosis of membrane proteins to the apical surface. By contrast, stable microtubules, which are not functionally affected by 201-F treatment, are involved in the transport of membrane proteins to the basolateral surface. By specifically disassembling highly dynamic microtubules, 201-F is an invaluable tool with which to study the functional specialization of stable and dynamic microtubules in living cells.


Figures

Figure 1
Figure 1
Effect of 201-F on the MT network of WIF-B cells. Cells grown for 8 d on glass coverslips were treated for 60 min without (a, d, f, g) or with 25 μM 201-F (b, e, h). 201-F treatment was extended to 4 h in c. After fixation and permeabilization for 3 min in −20°C methanol, MTs were labeled using antibodies to α-tubulin (a, b, c), acetylated tubulin (d, e), detyrosinated (f), polyglutamylated (g), or tyrosinated tubulin (h). After incubation with FITC-labeled secondary antibodies, coverslips were examined by confocal microscopy. Bile canaliculi are indicated by arrowheads. Bar, 10 μm.
Figure 2
Figure 2
Quantification of α- and acetylated tubulin in MTs during 201-F and nocodazole treatments. WIF-B cells cultured in 12-well plates were incubated for times ranging between 15 min and 4 h with either 25 μM 201-F (closed symbols), or 10 μM nocodazole (open symbols). At the end of the treatment, soluble tubulin was extracted in MT-stabilizing buffer containing 0.15% Triton X-100 (1 min at 37°C) followed by one rinse in Triton-free buffer. Cells were lysed directly using SDS-PAGE sample buffer. Sample lysates and the corresponding cell extracts were analyzed by Western blotting. α- and acetylated tubulin were quantified using enhanced chemiluminescence assay on BioMax films (Eastman Kodak Co.). Data are expressed relative to the MT contents measured in untreated cells. Each value is the mean ± SD of three to five independent experiments.
Figure 3
Figure 3
MTs that resist 201-F treatment are stable. In a first series of experiments, control (a) and 201-F–treated cells (b) were permeabilized using 0.2 mg/ml saponin in Hepes buffer to trigger dilution- induced depolymerization of MTs. MTs were labeled with antibodies to acetylated tubulin, and were observed by means of confocal microscopy. Images are the superimposition of four equidistant optical sections (δz = 1.5 μm). Bar, 10 μm. In a second set of experiments (c–g), cells were treated with 25 μM 201-F for 1 h. 10 μM nocodazole was then added into the culture medium for 15 (d) or 60 min (f). 1-h 201-F and 1h-nocodazole controls are shown in c and e, respectively. Cells were then fixed and processed for the immunofluorescent labeling of α-tubulin (c–f). Soluble α-tubulin was also extracted with MT-stabilizing buffer containing 0.15% Triton X-100. Cellular (C) and extracted (E) α-tubulin was analyzed by Western blot (n = 3; g).
Figure 4
Figure 4
Dynamic MTs are selectively depolymerized by 201-F treatment in fibroblastic and epithelial cells. Fao rat hepatoma cells (a–c), human pulmonary fibroblasts (d–f), HeLa cells (g–i), and MDCK cells (j–l) were treated without (a, d, g, j) or with 25 μM 201-F for 1 h (b–c, e–f, h–i, k–l). In some cases, 10 μM nocodazole was added into the culture medium for 15 min at the end of the 1-h 201-F treatment (c, f, i, l). After three washes with MT-stabilizing buffer, soluble tubulin was extracted with warm MT-stabilizing buffer containing 0.02% Triton X-100 (37°C, 4× for 1 min). After fixation (methanol at −20°C for 5 min), cells were processed for immunofluorescence labeling of α-tubulin and examined in a fluorescence microscope. For MDCK cells, three optical sections of the same cells were taken near the basal domain (left), across the lateral domain (middle) and near the apical domain (right) in each panel (j–l). Bar, 10 μm.
Figure 5
Figure 5
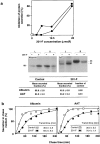
201-F inhibits secretion of albumin and AAT in WIF-B cells. Cells were depleted of methionine and cysteine for 30 min, and then newly synthesized proteins were radiolabeled for 15 min with [35S]methionine and cysteine, and were chased for various times. When appropriate, 25 μM 201-F was added into the depletion, pulse, and chase media. Albumin (circles) and AAT (squares) were immunoprecipitated from cell lysates and chase supernatants, and were quantified by SDS-PAGE fluorography and densitometry. Secretion is expressed as the ratio of secreted protein to total (secreted plus intracellular) immunoprecipitated protein to normalize for the variations in the incorporation of [35S]methionine and cysteine. Secretion inhibition was measured relative to control values at the last chase time. (a) Effect of 201-F on albumin and AAT secretion after 1 h of chase. In the upper graph, the concentration-dependent effect of 201-F is shown. The lower part of the panel summarizes the data (mean secreted fractions ± SEM) from four (AAT) to eight experiments (albumin), and show a sample SDS-PAGE of albumin and AAT immunoprecipitated from cell lysates (L) and chase supernatants (S). (b) Secretion kinetics of albumin and AAT in control (open symbols) and 201-F-treated cells (closed symbols). Kinetic data are fitted to a three-compartment model for secretion by a nonlinear least-square method. Transit times are the sum of the reciprocals of the two rate constants computed from experimental data; they are the mean ± SEM of three independent determinations.
Figure 6
Figure 6
201-F causes MT-dependent fragmentation of the Golgi complex. Cells were treated without (a, b) or with (c, d) 25 μM 201-F for 1 h, fixed, and processed for double immunofluorescence labeling using antibodies to Man II (a, c) and secretory albumin (b, d). In a second set of experiments, cells were treated with 10 μM taxol for 2 h in serum-free culture medium to stabilize MTs (e, f, i, j), or with taxol alone for 1 h and then with a mixture of taxol and 201-F for one more hour (g, h, k, l). After fixation, cells were subjected to double immunofluorescence labeling of Man II (e, g) and albumin (f, h), or that of α-tubulin (i, k) and albumin (j, l). All samples were examined in a confocal microscope. Bar, 10 μm.
Figure 7
Figure 7
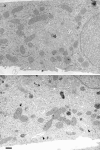
In 201-F-treated cells, the Golgi fragments are composed of stacked cisternae. The Golgi fragments were visualized by electron microscopy in control cells (a) or after cells were treated for 60 min with 201-F (b). Cells were fixed with 3% glutaraldehyde in sodium phosphate buffer, post-fixed in 1% osmic acid, embedded in Epon, and ultrathin sections were counterstained with uranyl acetate and lead citrate. In a typical control cell, the Golgi complex was observed as a condensed organelle (asterix) located close to the nucleus. 201-F–treated cells exhibited Golgi fragments with stacked cisternae (arrowheads). Bar, 0.5 μm.
Figure 8
Figure 8
Neither Golgi fragmentation nor a direct effect of 201-F on Golgi membranes are responsible for the inhibitory effect of 201-F on protein secretion. In a, cells were treated for 1.5 h with 10 μM nocodazole. Nocodazole was then washed out to allow reconstitution of the MT network and compaction of Golgi fragments. At various times ranging from 0 to 90 min after drug removal, cells were fixed, processed for double immunofluorescence labeling of α-tubulin (left side) and albumin (right side), and examined in a fluorescence microscope. Bar, 10 μm. b shows the mean secreted fractions ± SEM of albumin after 1-h pulse–chase experiments performed in the following conditions: (1) no treatment; (2) 10 μM nocodazole pretreatment (1 h) and depletion of methionine and cysteine in the presence of nocodazole (30 min), radiolabeling (15 min), and chase (60 min) without nocodazole; (3) 10 μM nocodazole pretreatment (4 h), depletion (30 min), pulse labeling (15 min), and chase periods (60 min) in the presence of nocodazole; (4)10 μM nocodazole pretreatment (4 h), adding 25 μM 201-F during depletion (30 min), pulse labeling (15 min), and chase period (60 min); (5–7) Depletion (30 min), pulse labeling (15 min), and chase (60 min) in the presence of 25 μM 201-F (5), 10 μM nocodazole (6), or 10 μM taxol (7); (8) 10 μM taxol pretreatment (1 h), adding 25 μM 201-F during the depletion (30 min), pulse labeling (15 min), and chase period (60 min). Data are the mean ± SEM of eight (1, 5, 6), four (2), or three experiments (3, 4, 7, 8). Statistical comparisons were performed using the Mann and Whitney test. Identical results were obtained with AAT (not shown). c shows the inhibition of albumin secretion measured during the time course of nocodazole treatment. Cells were pretreated with 10 μM nocodazole for times ranging from 0 to 11 h before methionine and cysteine depletion and pulse-labeling with 35S methionine and cysteine in the presence of the drug. Radiolabeled proteins were chased for 1 h in the presence of nocodazole, and then albumin was immunoprecipitated from chase supernatants and cell lysates. After measurement of the mean secreted fractions of albumin, secretion inhibition was calculted relative to control values. Data are the mean ± SEM of three independent determinations.
Figure 9
Figure 9
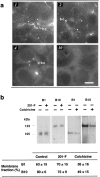
Stable MTs are involved in the transport of membrane proteins to the basolateral surface of WIF-B cells. In a, cells were treated for times ranging between 1 and 10 h with 10 μM colchicine. To minimize background fluorescence, soluble tubulin was extracted by permeabilizing cells with 0.15% Triton X-100 in MT-stabilizing buffer (1 min, 37°C). Cells were then fixed, processed for immunofluorescence labeling of α-tubulin, and examined in a fluorescence microscope. Short MTs were still observed in cells treated for up to 4 h with colchicine (arrowheads), but could not be detected after 10 h of treatment. When present, bile canaliculi (b.c) are identified. Bar, 10 μM. b shows the effects of 1-h treatment with 201-F and 10-h treatment with colchicine on basolateral membrane expression of B1 and B10 proteins. Newly synthesized proteins were radiolabeled and chased for 1 h in the presence of 201-F or colchicine, and were then subjected to surface biotinylation. Total B1 and B10 were first immunoprecipitated from cell lysates, and then the biotinylated fractions were precipitated using streptavidin-agarose. Samples were analyzed by SDS-PAGE, fluorography and densitometry. Membrane fractions of B1 and B10 are the mean ± SD of three determinations.
Figure 10
Figure 10
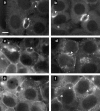
Dynamic MTs are involved in the transcytosis of B10 and DPP IV from the basolateral to apical surface of WIF-B cells. Control (a, b), 201-F-treated (2 h, 25 μM; c, d) and nocodazole-treated cells (10 h, 10 μM; e, f), were incubated at 37°C for 2 h with anti-DPP IV (a, c, e) or anti-B10 antibodies (b, d, f). After washing with PBS, cells were fixed, and the immune complexes were revealed using FITC- labeled secondary antibody. Cells were examined in a fluorescence microscope. Bar, 10 μm.

Similar articles

Cited by

References

    1. Bartles JR, Feracci HM, Stieger B, Hubbard AL. Biogenesis of the rat hepatocyte plasma membrane in vivo: comparison of the pathways taken by apical and basolateral proteins using subcellular fractionation. J Cell Biol. 1987;105:1241–1251. - PMC - PubMed
    1. Biou D, Monnet D, Millet D, Feger J, Durand G. An immunochemical procedure to evaluate the degree of desialylation of alpha1-acid glycoprotein in rat serum. J Immunol Methods. 1984;74:267–271. - PubMed
    1. Boll W, Partin JS, Katz AI, Caplan MJ, Jamieson JD. Distinct pathways for basolateral targeting of membrane and secretory proteins in polarized epithelial cells. Proc Natl Acad Sci USA. 1991;88:8592–8596. - PMC - PubMed
    1. Breitfield PP, McKinnon WC, Mostov KE. Effect of nocodazole on vesicular traffic to the apical and basolateral surfaces of polarized MDCK cells. J Cell Biol. 1990;111:2365–2373. - PMC - PubMed
    1. Carlson J, Stenflo J. The biosynthesis of rat alpha-1-antitrypsin. J Biol Chem. 1982;257:12987–12994. - PubMed

Publication types