. 1998 Jul 13;142(1):217-27.
doi: 10.1083/jcb.142.1.217.

Regulation of angiotensin II-induced neuromodulation by MARCKS in brain neurons

Affiliations

Regulation of angiotensin II-induced neuromodulation by MARCKS in brain neurons

D Lu et al. J Cell Biol. .

Abstract

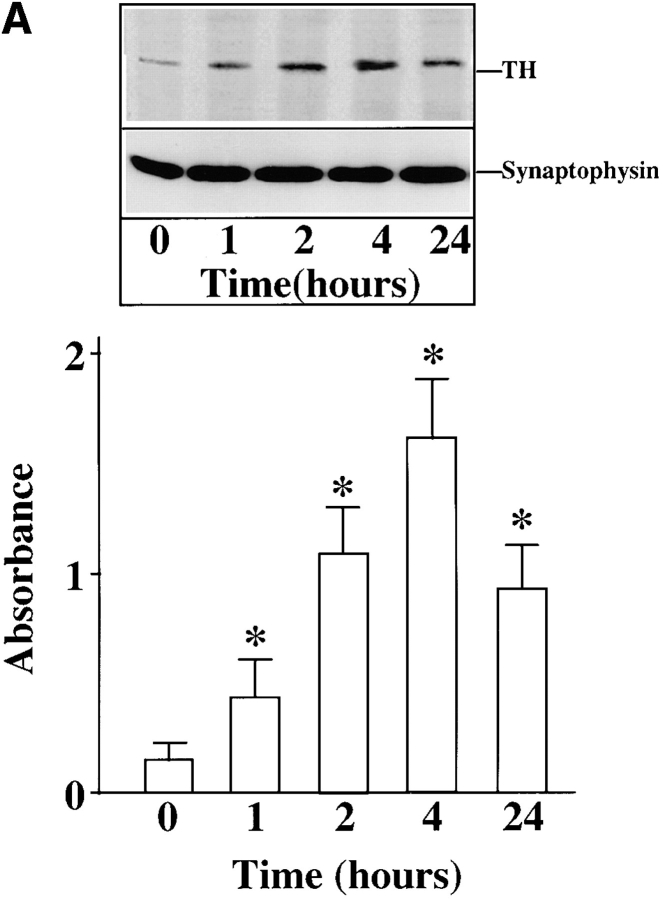
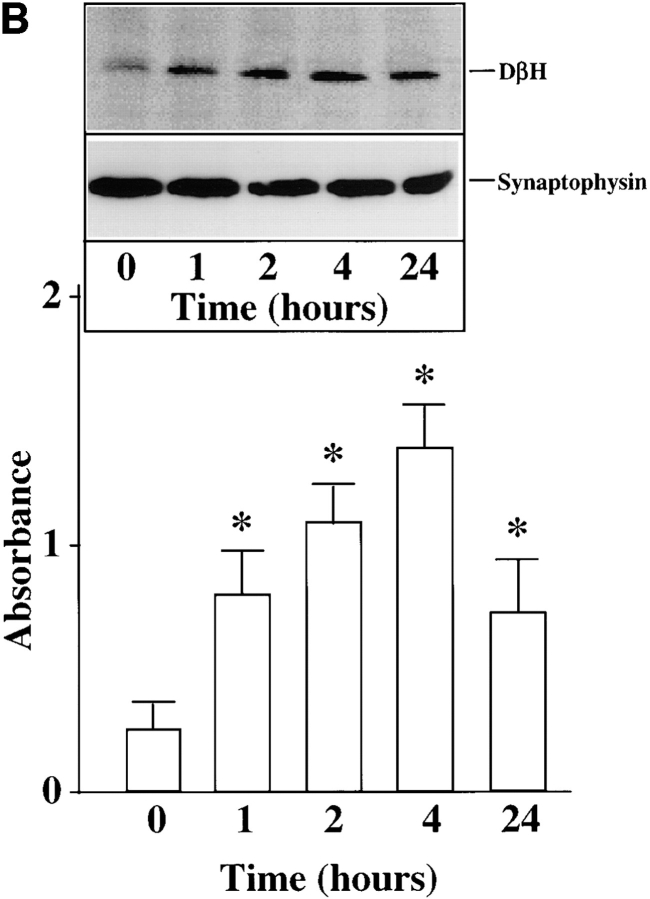
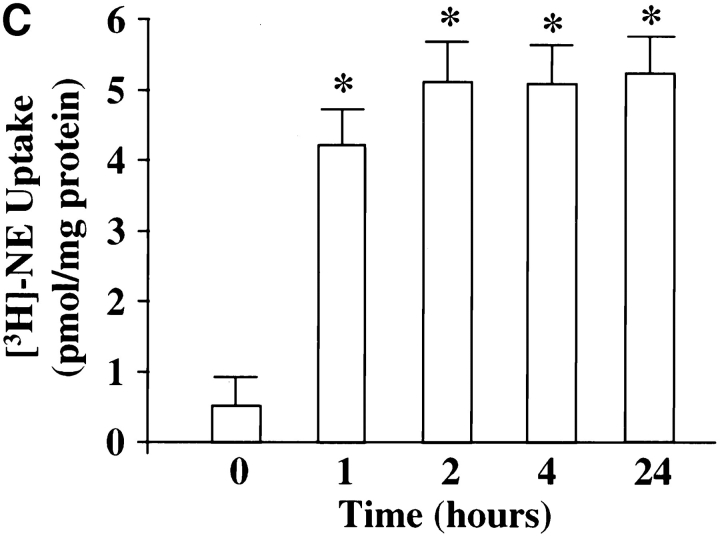
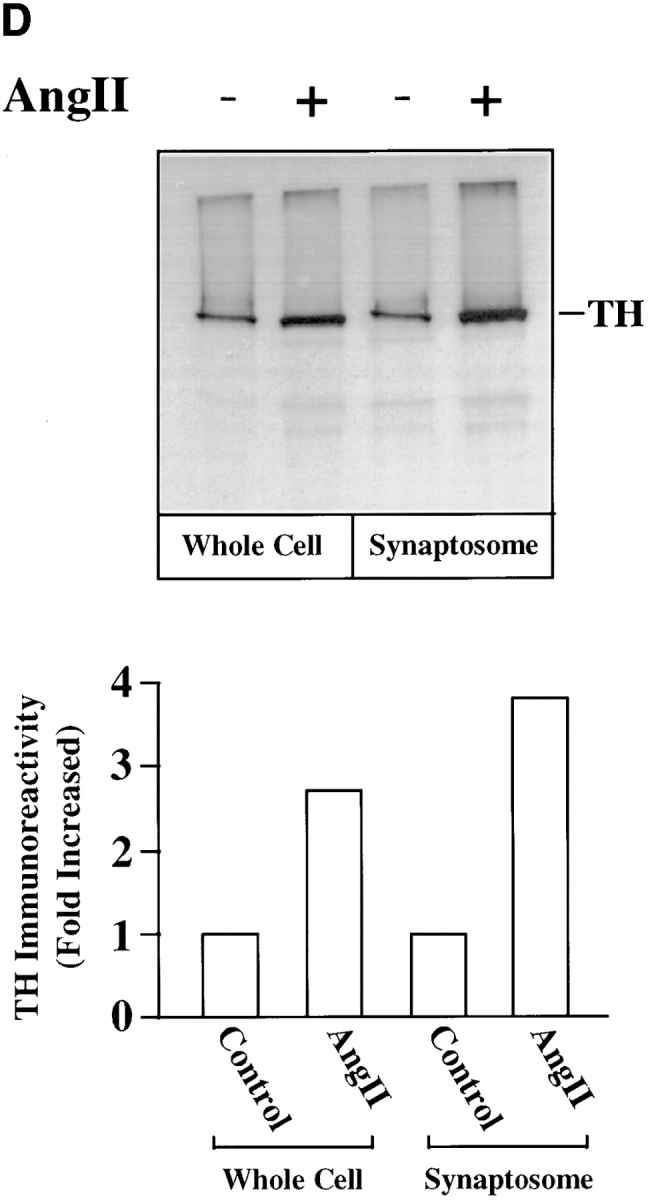
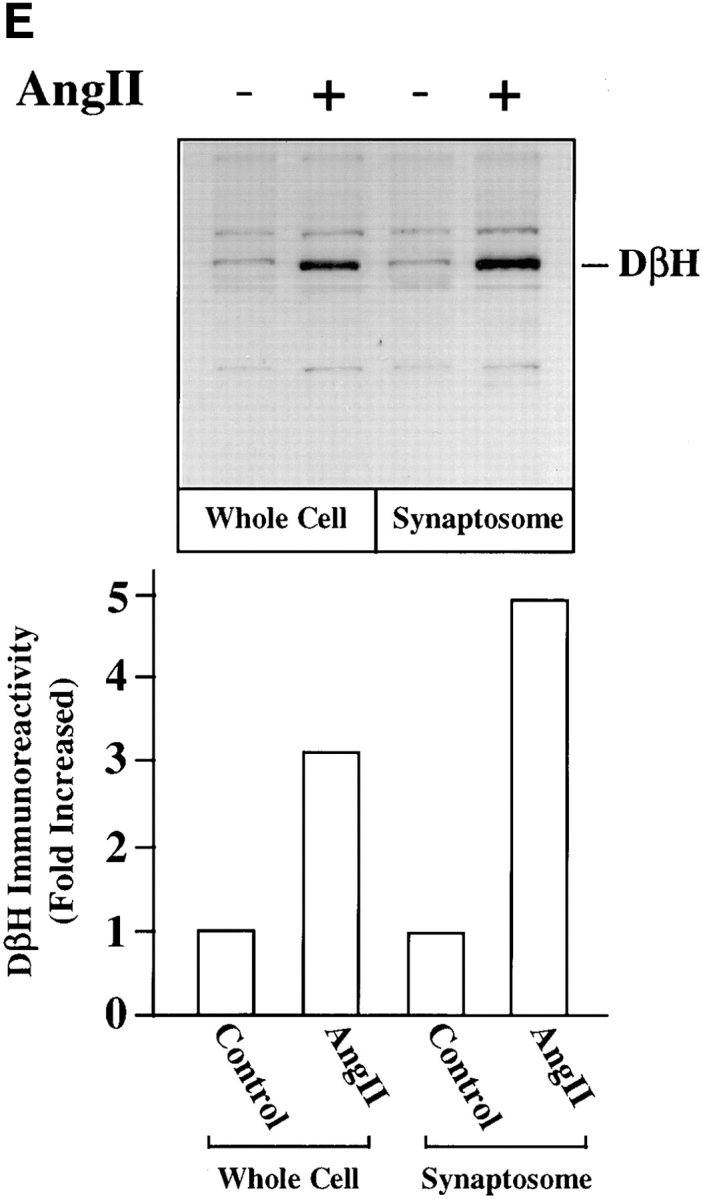
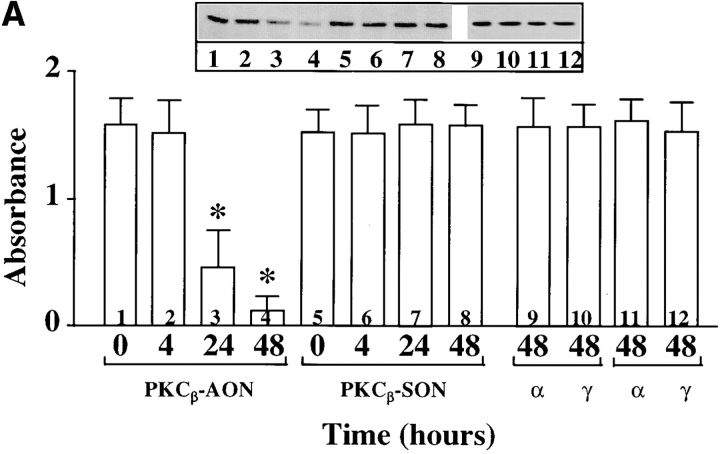
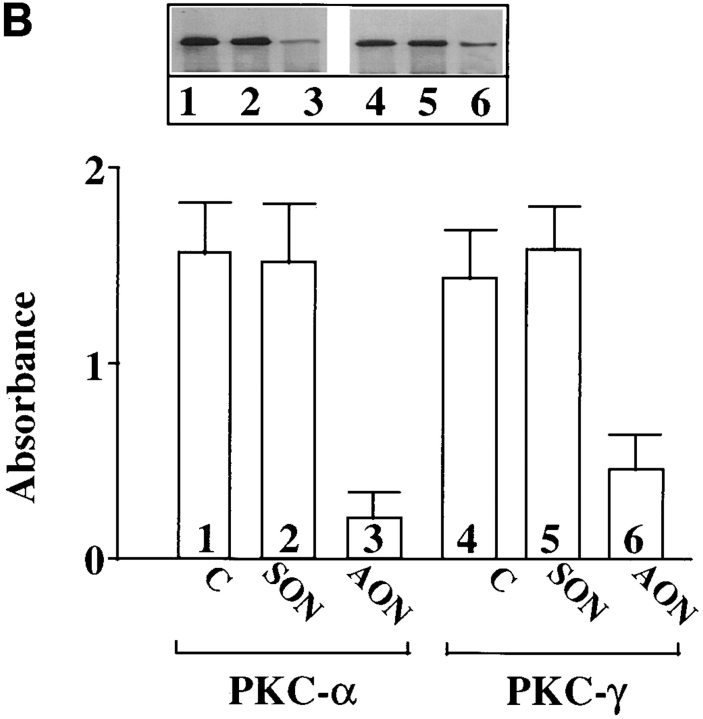
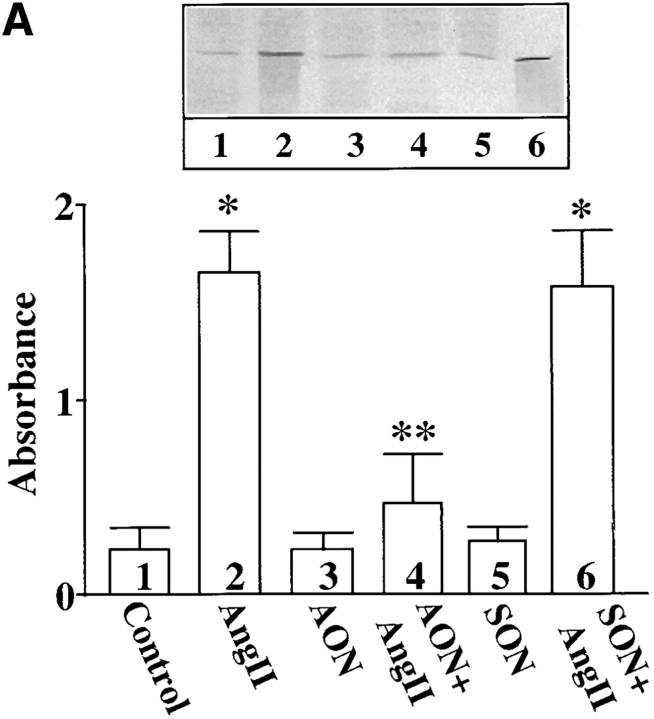
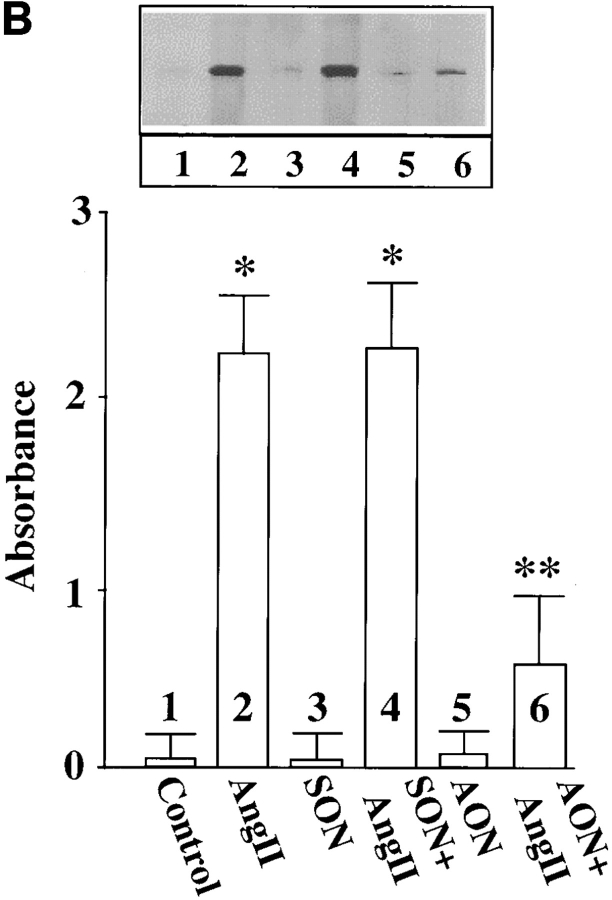
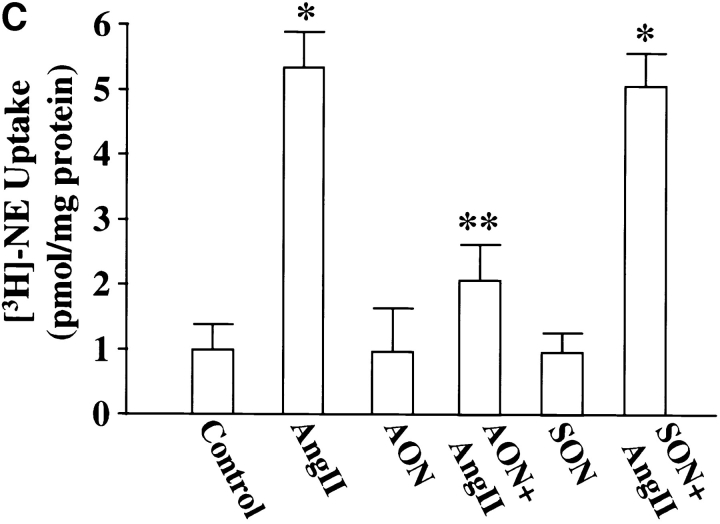
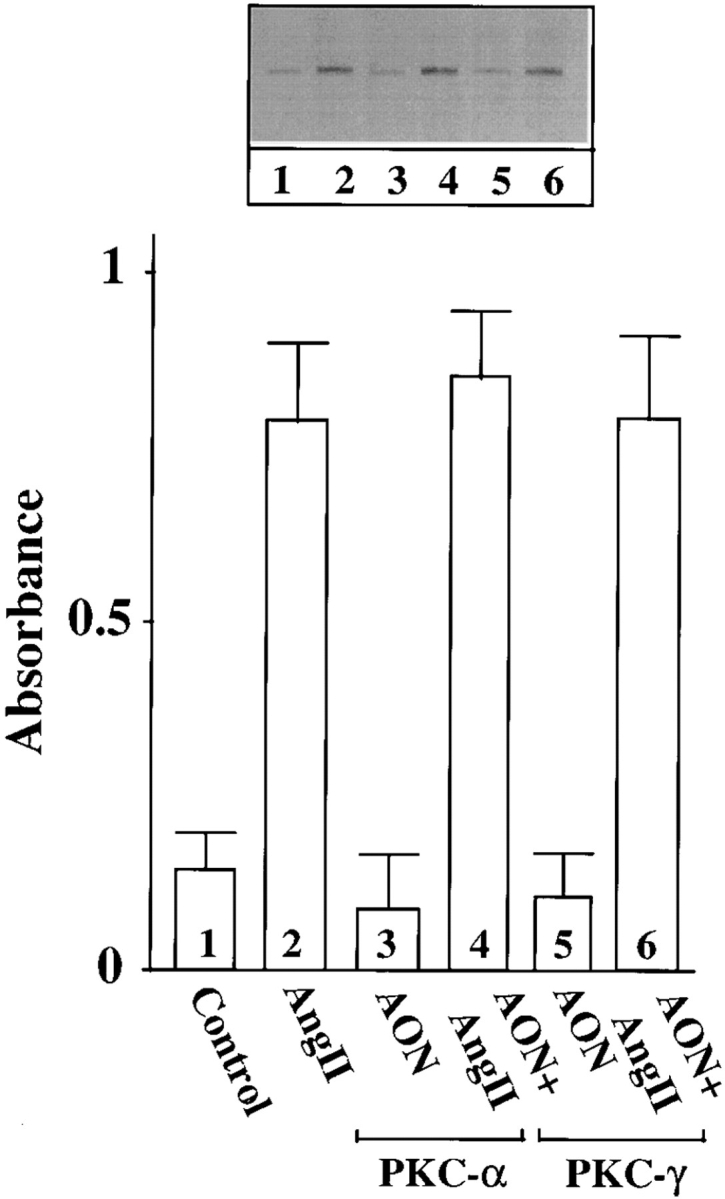
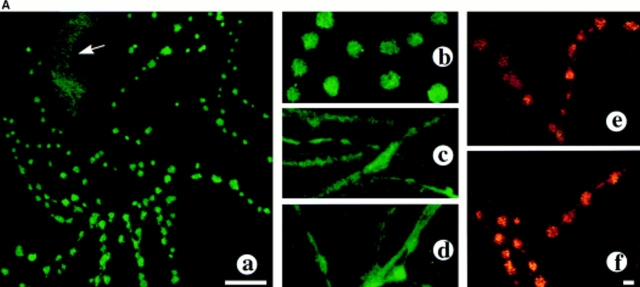
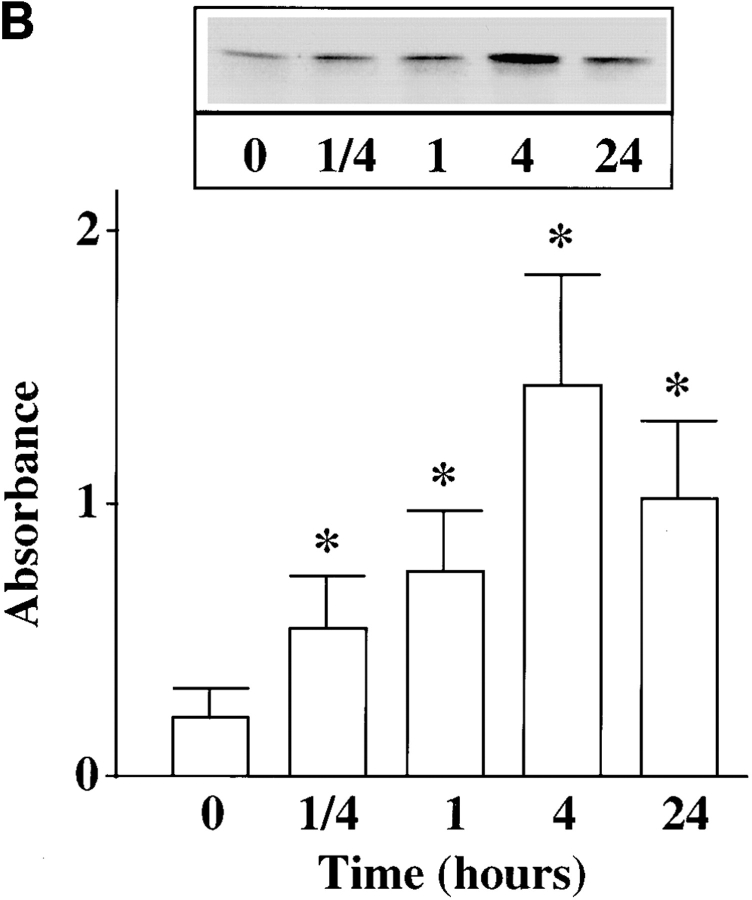
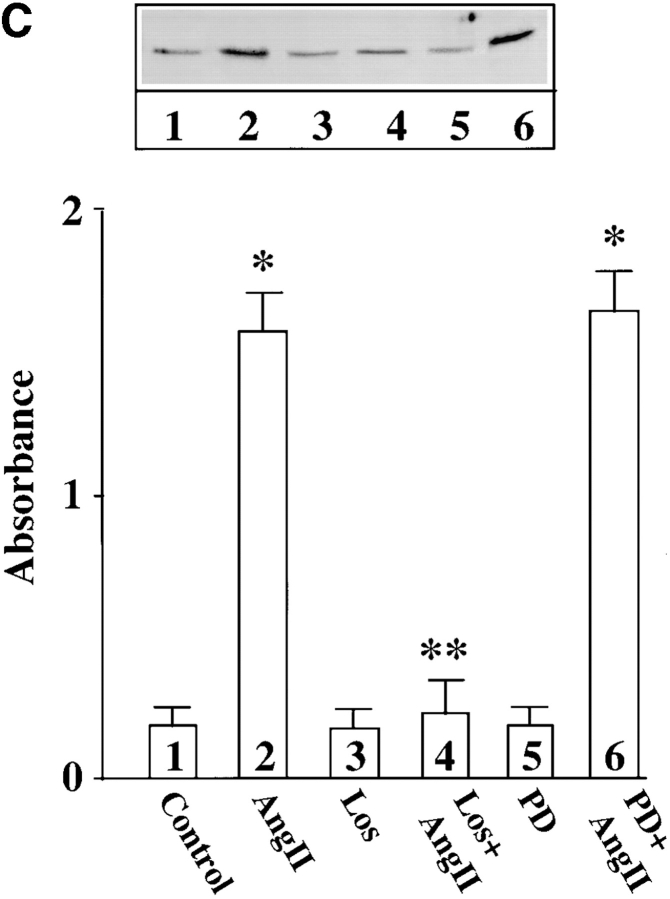
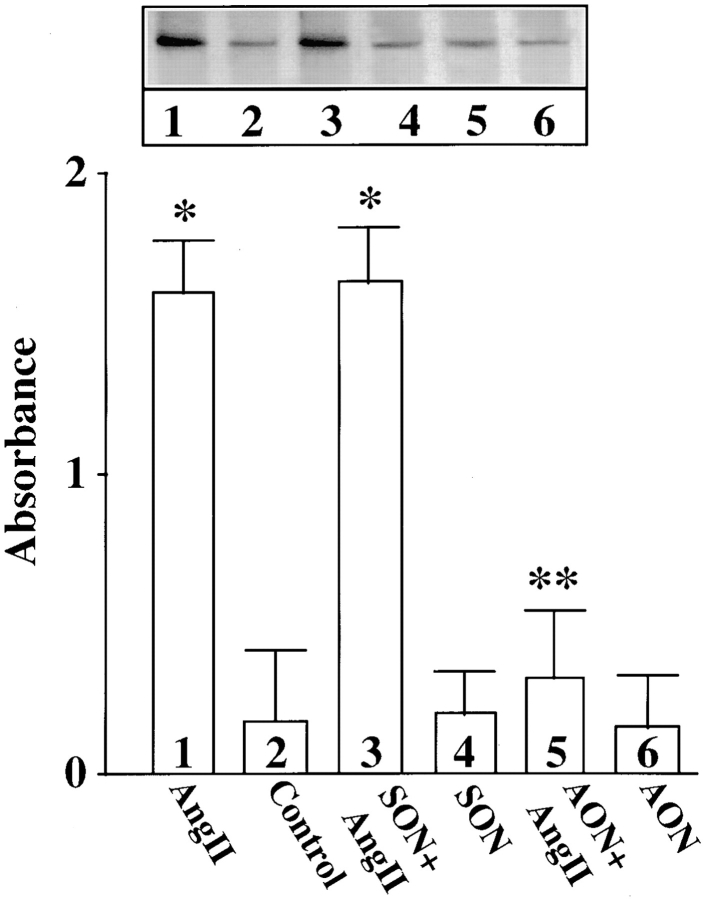
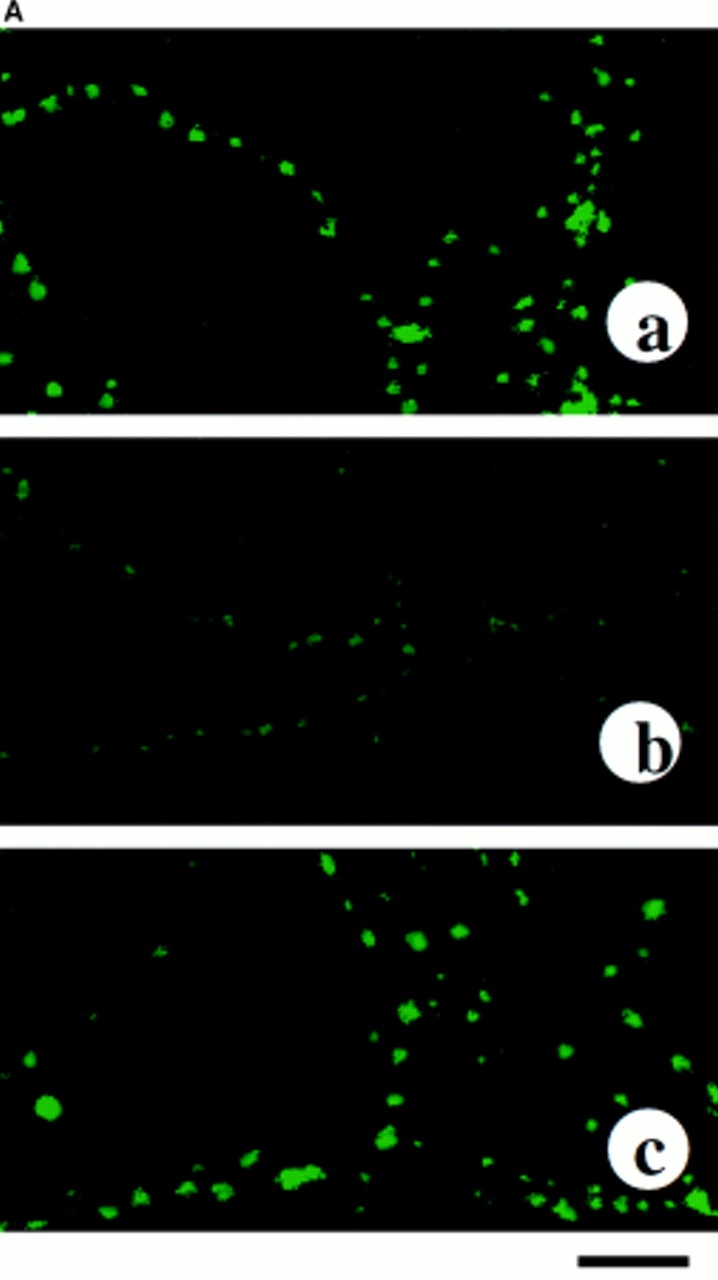
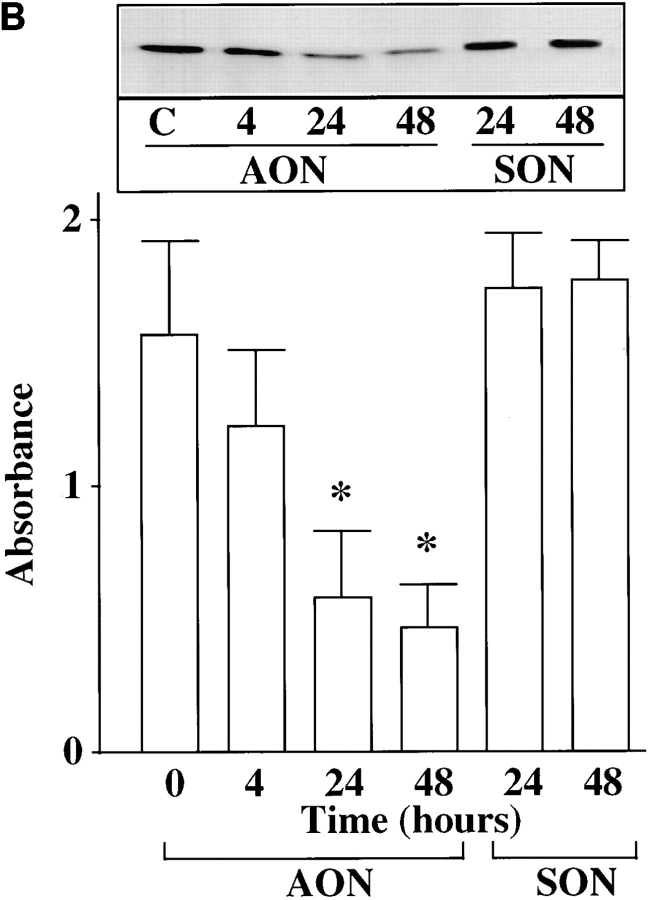
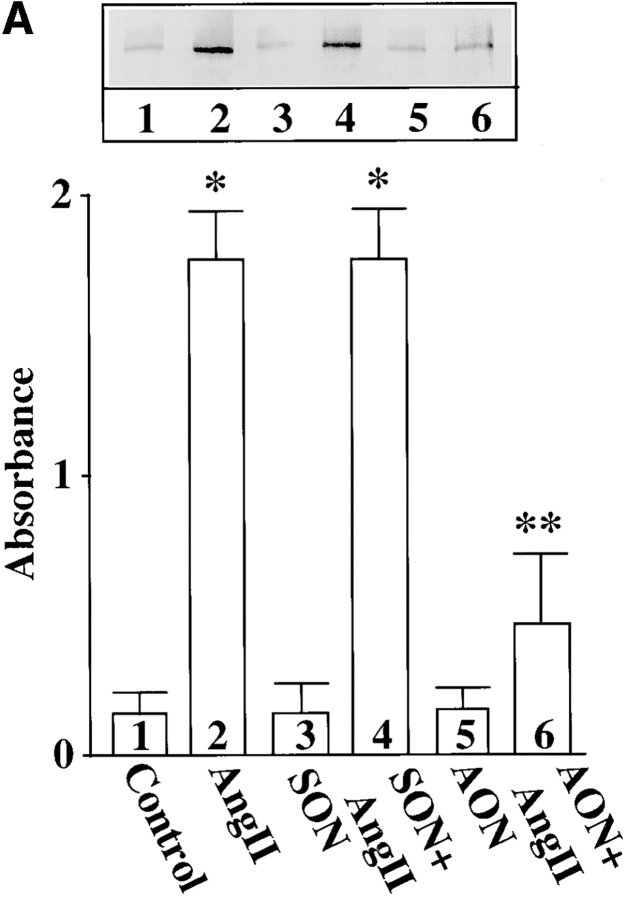
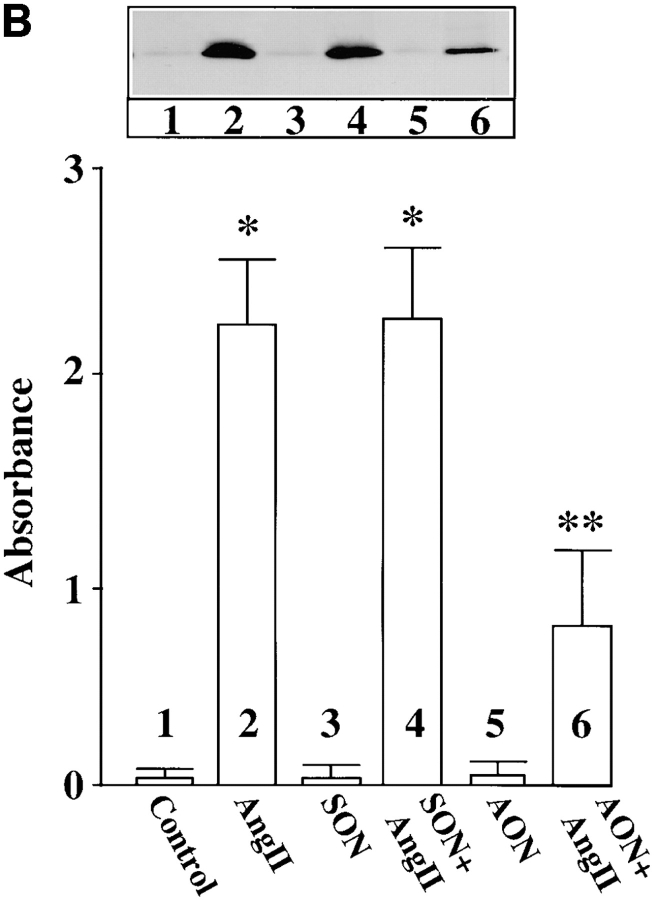
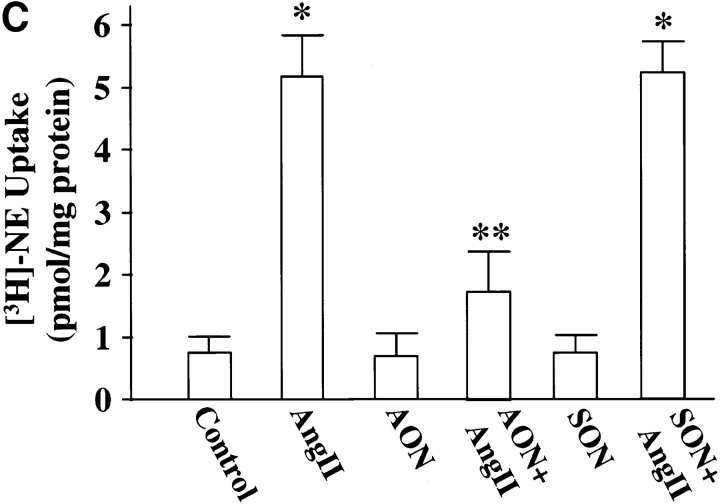
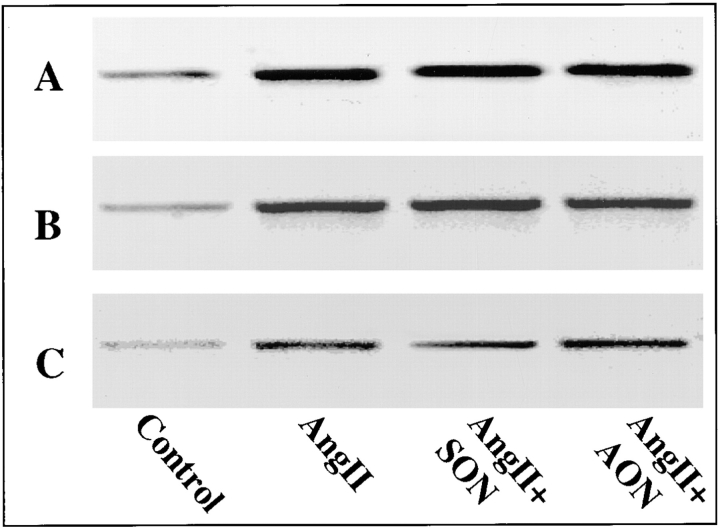
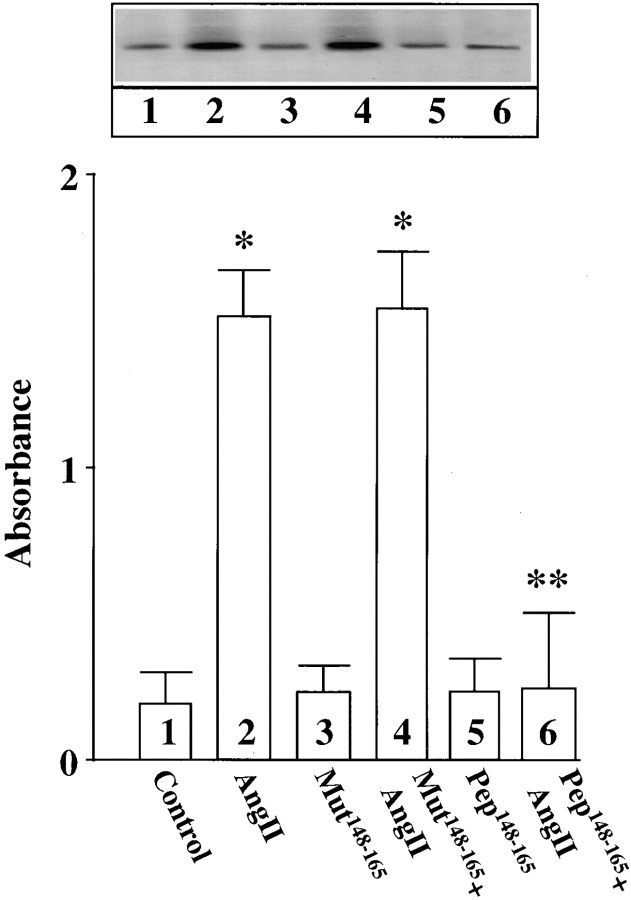
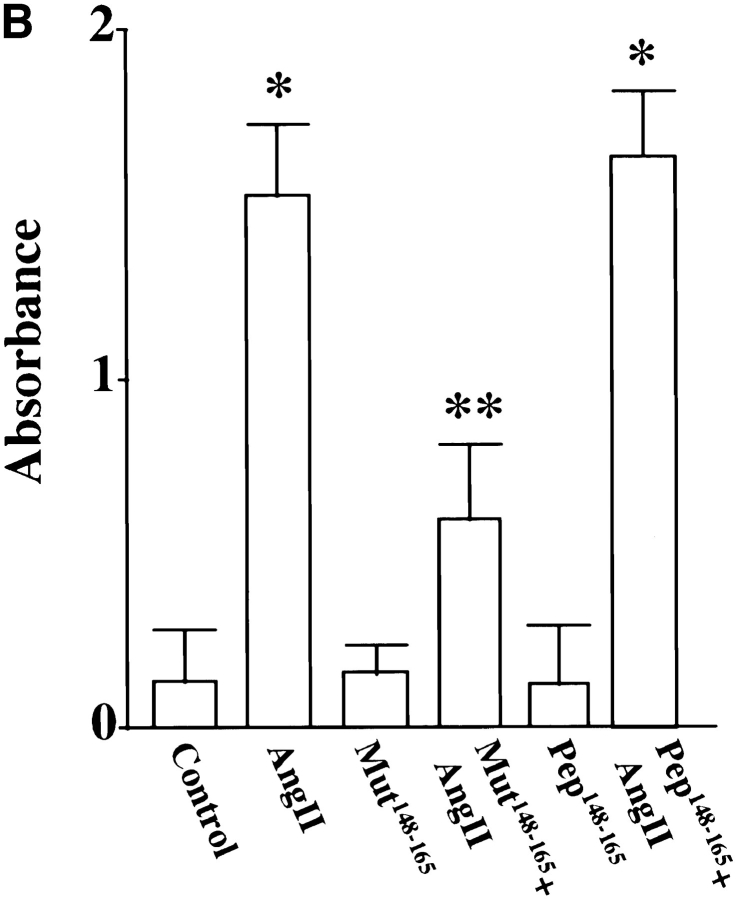
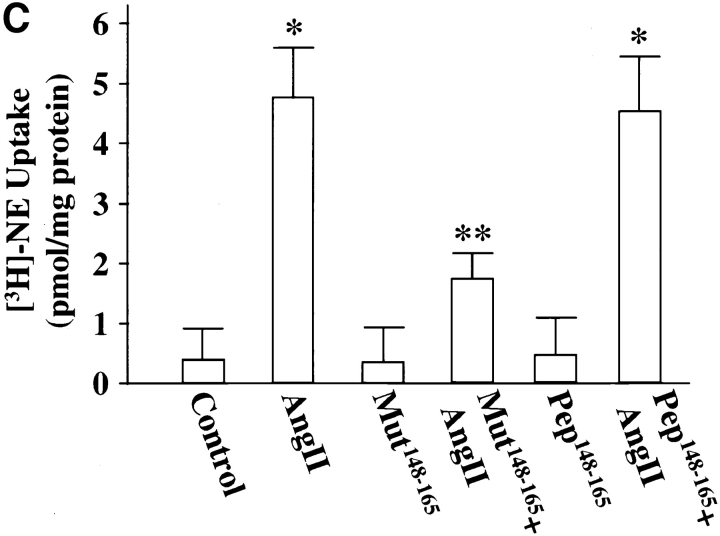
Angiotensin II (Ang II) exerts chronic stimulatory actions on tyrosine hydroxylase (TH), dopamine beta-hydroxylase (DbetaH), and the norepinephrine transporter (NET), in part, by influencing the transcription of their genes. These neuromodulatory actions of Ang II involve Ras-Raf-MAP kinase signal transduction pathways (Lu, D., H. Yang, and M.K. Raizada. 1997. J. Cell Biol. 135:1609-1617). In this study, we present evidence to demonstrate participation of another signaling pathway in these neuronal actions of Ang II. It involves activation of protein kinase C (PKC)beta subtype and phosphorylation and redistribution of myristoylated alanine-rich C kinase substrate (MARCKS) in neurites. Ang II caused a dramatic redistribution of MARCKS from neuronal varicosities to neurites. This was accompanied by a time-dependent stimulation of its phosphorylation, that was mediated by the angiotensin type 1 receptor subtype (AT1). Incubation of neurons with PKCbeta subtype specific antisense oligonucleotide (AON) significantly attenuated both redistribution and phosphorylation of MARCKS. Furthermore, depletion of MARCKS by MARCKS-AON treatment of neurons resulted in a significant decrease in Ang II-stimulated accumulation of TH and DbetaH immunoreactivities and [3H]NE uptake activity in synaptosomes. In contrast, mRNA levels of TH, DbetaH, and NET were not influenced by MARKS-AON treatment. MARCKS pep148-165, which contains PKC phosphorylation sites, inhibited Ang II stimulation of MARCKS phosphorylation and reduced the amount of TH, DbetaH, and [3H]NE uptake in neuronal synaptosomes. These observations demonstrate that phosphorylation of MARCKS by PKCbeta and its redistribution from varicosities to neurites is important in Ang II-induced synaptic accumulation of TH, DbetaH, and NE. They suggest that a coordinated stimulation of transcription of TH, DbetaH, and NET, mediated by Ras-Raf-MAP kinase followed by their transport mediated by PKCbeta-MARCKS pathway are key in persistent stimulation of Ang II's neuromodulatory actions.


Figures

Figure 1
Figure 1
Effects of Ang II on TH, DβH immunoreactivities, and [3H]NE uptake in synaptosomes and whole cells of brain neurons. (A–C) Neuronal cultures were incubated with 100 nM Ang II for indicated time periods, synaptosomes were prepared and subjected to quantitation of TH (A) and DβH (B) immunoreactivities, and [3H]NE uptake (C) activities essentially as described in Materials and Methods. A comparable amount of proteins in each sample were also electrophoresed and subjected to Western blotting with the use of antibodies to synaptophysin. Top in A and B are representative autoradiograms. Bottom in A and B are mean data from three experiments mean ± SE. Data in C are mean ± SE (n = 3). *, significantly different (P < 0.01) from zero time. (D and E) TH and DβH levels in whole cells and synaptosomes. After treatment with Ang II for 4 h essentially as described above, whole neuronal cells and synaptosomal preparation from them were subjected to TH (D) and DβH (E) Western blotting. Equal amounts of proteins (20 μg) were used for electrophoresis. Top in D and E are representative autodiagrams. Bottom, mean data from two experiments.
Figure 1
Figure 1
Effects of Ang II on TH, DβH immunoreactivities, and [3H]NE uptake in synaptosomes and whole cells of brain neurons. (A–C) Neuronal cultures were incubated with 100 nM Ang II for indicated time periods, synaptosomes were prepared and subjected to quantitation of TH (A) and DβH (B) immunoreactivities, and [3H]NE uptake (C) activities essentially as described in Materials and Methods. A comparable amount of proteins in each sample were also electrophoresed and subjected to Western blotting with the use of antibodies to synaptophysin. Top in A and B are representative autoradiograms. Bottom in A and B are mean data from three experiments mean ± SE. Data in C are mean ± SE (n = 3). *, significantly different (P < 0.01) from zero time. (D and E) TH and DβH levels in whole cells and synaptosomes. After treatment with Ang II for 4 h essentially as described above, whole neuronal cells and synaptosomal preparation from them were subjected to TH (D) and DβH (E) Western blotting. Equal amounts of proteins (20 μg) were used for electrophoresis. Top in D and E are representative autodiagrams. Bottom, mean data from two experiments.
Figure 2
Figure 2
(A) Effect of PKCβ AON on PKCα, PKCβ, and PKCγ immunoreactivities in brain neurons. Neuronal cultures were incubated with 2.5 μM PKCβ AON or SON for indicated time periods. Cells were lysed and lysates were used for Western blot to determine levels of PKCβ, PKCα, and PKCγ as described in the Materials and Methods. Top, a representative autoradiogram. Bottom, data from three experiments mean ± SE. *, significantly different from control (P < 0.05). (B) Effects of PKCα and PKCγ AON and SON on PKCα and PKCγ immunoreactivities in brain neurons. Neuronal cultures were treated with 2.5 μM PKCα or PKCγ AON or SON for 48 h at 37°C essentially as described for PKCβ above. Levels of PKCα and PKCγ was determined by Western blot. Top, representative autoradiogram. Bottom, mean ± SE (n = 3).
Figure 2
Figure 2
(A) Effect of PKCβ AON on PKCα, PKCβ, and PKCγ immunoreactivities in brain neurons. Neuronal cultures were incubated with 2.5 μM PKCβ AON or SON for indicated time periods. Cells were lysed and lysates were used for Western blot to determine levels of PKCβ, PKCα, and PKCγ as described in the Materials and Methods. Top, a representative autoradiogram. Bottom, data from three experiments mean ± SE. *, significantly different from control (P < 0.05). (B) Effects of PKCα and PKCγ AON and SON on PKCα and PKCγ immunoreactivities in brain neurons. Neuronal cultures were treated with 2.5 μM PKCα or PKCγ AON or SON for 48 h at 37°C essentially as described for PKCβ above. Levels of PKCα and PKCγ was determined by Western blot. Top, representative autoradiogram. Bottom, mean ± SE (n = 3).
Figure 3
Figure 3
Effect of PKCβ AON and SON on Ang II stimulation of transport of TH, DβH, and [3H]NE uptake activities in the synaptosomes of brain neurons. Neuronal cultures were pretreated with 2.5 μM PKCβ AON or SON for 48 h, essentially as described in Fig. 2. This was followed by incubation of cells with 100 nM Ang II for 4 h. Synaptosomes were prepared and TH (A), DβH (B), and [3H]NE (C) uptake activities were determined as described in Materials and Methods. Top in A and B show representative autoradiograms. Bottom, mean data from three experiments ± SE. Data in C are mean ± SE (n = 3). *, significantly different (P < 0.05) from control. **, significantly different (P < 0.01) from Ang II–treated neurons.
Figure 3
Figure 3
Effect of PKCβ AON and SON on Ang II stimulation of transport of TH, DβH, and [3H]NE uptake activities in the synaptosomes of brain neurons. Neuronal cultures were pretreated with 2.5 μM PKCβ AON or SON for 48 h, essentially as described in Fig. 2. This was followed by incubation of cells with 100 nM Ang II for 4 h. Synaptosomes were prepared and TH (A), DβH (B), and [3H]NE (C) uptake activities were determined as described in Materials and Methods. Top in A and B show representative autoradiograms. Bottom, mean data from three experiments ± SE. Data in C are mean ± SE (n = 3). *, significantly different (P < 0.05) from control. **, significantly different (P < 0.01) from Ang II–treated neurons.
Figure 4
Figure 4
Effects of PKCα and PKCg AONs on Ang II stimulation of the transport of TH in the synaptosomes of brain neurons. Neuronal cultures were pretreated with 2.5 μM PKCα AON or PKCγ AON for 48 h at 37°C. This was followed by incubation of cells with 100 nM Ang II for 4 h. Synaptosomes were prepared and TH immunoreactivity was determined essentially as described in the Materials and Methods. Top, representative autoradiogram. Bottom, mean of two independent experiments.
Figure 5
Figure 5
Effects of Ang II on neuronal MARCKS. (A) Effect of Ang II on immunocytochemical localization of MARCKS. Neuronal cultures were treated without (a and b) or with 100 nM Ang II for 0.5 h (c) and 4 h (d–f) followed by immunocytochemical analysis of MARCKS immunoreactivity (a–d). Samples in e and f were double stained with the use of antibodies to MARCKS and synaptophysin (e) or MARCKS and TH (f) essentially as described previously (Lu et al., 1997). Confocal microscopy was carried out as described in Methods. Green color represents MARCKS and TH staining while yellow color presents co-staining of MARCKS with either synaptophysins (e) or with TH (f). a, depicts beaded localization of MARCKS in neuronal vercosities. Little distribution was seen in the cell soma (arrow). b, higher magnification of varicosities. c–f, treatment with Ang II resulted in redistribution of MARCKS and by 4 h it was uniformly distributed throughout neurites. (B) Effect of Ang II on MARCKS phosphorylation. Neuronal culture, pre-labeled with [32P]orthophosphate and incubated with 100 nM Ang II for indicated time periods. 32P-labeled MARCKS was immunoprecipitated by MARCKS-specific antibody and subjected to SDS-PAGE followed by autoradiography as described in the Materials and Methods. Top, a representative autoradiogram. Bottom, mean data from three experiments ± SE. *, significantly different (P < 0.05) from time zero. (C) Effect of Ang receptor antagonists on MARCKS phosphorylation. Experimental conditions were essentially as described above in Fig. 4 B, except cultures were incubated without (1, 3, 5) or with 100 nM Ang II (2, 4, 6) in the presence of either 10 μM losartan (3 and 4) or 10 μM PD123,319 (5 and 6). *, significantly different (P < 0.05) from control. **, significantly different (P < 0.05) from Ang II–treated neurons. Bars in A: (a) 4 μm; (b–e) 4 μm.
Figure 5
Figure 5
Effects of Ang II on neuronal MARCKS. (A) Effect of Ang II on immunocytochemical localization of MARCKS. Neuronal cultures were treated without (a and b) or with 100 nM Ang II for 0.5 h (c) and 4 h (d–f) followed by immunocytochemical analysis of MARCKS immunoreactivity (a–d). Samples in e and f were double stained with the use of antibodies to MARCKS and synaptophysin (e) or MARCKS and TH (f) essentially as described previously (Lu et al., 1997). Confocal microscopy was carried out as described in Methods. Green color represents MARCKS and TH staining while yellow color presents co-staining of MARCKS with either synaptophysins (e) or with TH (f). a, depicts beaded localization of MARCKS in neuronal vercosities. Little distribution was seen in the cell soma (arrow). b, higher magnification of varicosities. c–f, treatment with Ang II resulted in redistribution of MARCKS and by 4 h it was uniformly distributed throughout neurites. (B) Effect of Ang II on MARCKS phosphorylation. Neuronal culture, pre-labeled with [32P]orthophosphate and incubated with 100 nM Ang II for indicated time periods. 32P-labeled MARCKS was immunoprecipitated by MARCKS-specific antibody and subjected to SDS-PAGE followed by autoradiography as described in the Materials and Methods. Top, a representative autoradiogram. Bottom, mean data from three experiments ± SE. *, significantly different (P < 0.05) from time zero. (C) Effect of Ang receptor antagonists on MARCKS phosphorylation. Experimental conditions were essentially as described above in Fig. 4 B, except cultures were incubated without (1, 3, 5) or with 100 nM Ang II (2, 4, 6) in the presence of either 10 μM losartan (3 and 4) or 10 μM PD123,319 (5 and 6). *, significantly different (P < 0.05) from control. **, significantly different (P < 0.05) from Ang II–treated neurons. Bars in A: (a) 4 μm; (b–e) 4 μm.
Figure 6
Figure 6
Effect of PKCβ AON on Ang II–induced MARCKS phosphorylation. Neuronal cultures were pre-treated with 2.5 μM SON or AON for PKCβ as described in legend to Fig. 2. After 24 h, 1 mCi/ml [32P]orthophosphate was added to the cultures and incubation was continued for an additional 20 h. 32P-labeled cells were incubated with 100 nM Ang II for 4 h. Immunoprecipitation of 32P-labeled MARCKS, followed by its quantitation, was carried out as described in Materials and Methods. Top, a representative autoradiogram. Bottom, mean ± SE (n = 3). *, significantly different (P < 0.05) from control. **, significantly different (P < 0.05) from Ang II–treated neurons.
Figure 7
Figure 7
Effect of MARCKS AON and SON treatments on neuronal MARCKS. (A) Neuronal cultures were treated without (a) or with 2.5 μM MARCKS AON (b) or 2.5 μM MARCKS SON (c) for 48 h. MARCKS immunoreactivity was determined by the use of confocal microscopy. (B) After treatment with MARCKS AON or SON for indicated time periods, levels of MARCKS were determined by Western blotting as described in Materials and Methods. Top, a representative autoradiogram. Bottom, mean data ± SE (n = 3). *, significantly different (P < 0.01) from control. Bar, 4 μm.
Figure 7
Figure 7
Effect of MARCKS AON and SON treatments on neuronal MARCKS. (A) Neuronal cultures were treated without (a) or with 2.5 μM MARCKS AON (b) or 2.5 μM MARCKS SON (c) for 48 h. MARCKS immunoreactivity was determined by the use of confocal microscopy. (B) After treatment with MARCKS AON or SON for indicated time periods, levels of MARCKS were determined by Western blotting as described in Materials and Methods. Top, a representative autoradiogram. Bottom, mean data ± SE (n = 3). *, significantly different (P < 0.01) from control. Bar, 4 μm.
Figure 8
Figure 8
Ang II stimulation of TH and DβH immunoreactivities, and [3H]NE uptake in MARCKS-depleted neurons. Neuronal cultures were pretreated with 2.5 μM MARCKS SON or AON for 48 h essentially as described in the legend to Fig. 7. Synaptosomal preparation was used to quantitate immunoreactive TH (A) or DβH (B) or specific [3H]NE uptake (C) as described in Materials and Methods. Top in A and B are representative autoradiograms. Bottom in A and B represented mean ± SE (n = 3). Data in C are mean ± SE (n = 3). *, significantly different (P < 0.01) from control. **, significantly different (P < 0.01) from Ang II–treated neurons.
Figure 8
Figure 8
Ang II stimulation of TH and DβH immunoreactivities, and [3H]NE uptake in MARCKS-depleted neurons. Neuronal cultures were pretreated with 2.5 μM MARCKS SON or AON for 48 h essentially as described in the legend to Fig. 7. Synaptosomal preparation was used to quantitate immunoreactive TH (A) or DβH (B) or specific [3H]NE uptake (C) as described in Materials and Methods. Top in A and B are representative autoradiograms. Bottom in A and B represented mean ± SE (n = 3). Data in C are mean ± SE (n = 3). *, significantly different (P < 0.01) from control. **, significantly different (P < 0.01) from Ang II–treated neurons.
Figure 9
Figure 9
Effects of MARCKS AON treatment on TH, DβH, and NET mRNA levels in neurons. Neuronal cultures were pretreated with 2.5 μM MARCKS AON or SON for 48 h. After incubation without or with 100 nM Ang II for 4 h, total RNA was isolated and mRNA levels for TH (A), DβH (B), and NET (C) were measured by reverse transcription PCR essentially as established by us previously (Lu et al., 1996; Yu et al., 1996).
Figure 10
Figure 10
Effect of MARCKS pep148–165 and mut148–165 on Ang II stimulation of phosphorylation of MARCKS. Neuronal cultures were prelabeled with [32P]orthophosphate and subjected to osmotic loading of MARCKS pep148–165 and mut148–165 essentially as described in Materials and Methods. After incubation with 100 nM Ang II for 4 h, radiolabeled MARCKS was immunoprecipitated and subjected to quantitation as described in Materials and Methods. Top, a representative autoradiogram. Bottom, mean absorbance data ± SE (n = 3). *, significantly different (P < 0.05) from control. **, significantly different (P < 0.05) from Ang II–treated neurons.
Figure 11
Figure 11
Effect of MARCKS peptide, pep148–165, on Ang II stimulation of TH and DβH immunoreactivities and [3H]NE uptake in neurons. pep148–165 or its mut148–165 was osmotically loaded, followed by incubation of the cells with 100 nM Ang II for 4 h as described in Materials and Methods. Synaptosomal preparations were used to measure the TH (A) and DβH (B) proteins, and [3H]NE uptake (C) as described in legend to Fig. 1. A and B, (top) represent autoradiograms. Bottom in A and B represent mean data ± SE (n = 3). Data in C are mean ± SE (n = 3). *, significantly different (P < 0.01) from the control. **, significantly different (P < 0.01) from Ang II–treated neurons.
Figure 11
Figure 11
Effect of MARCKS peptide, pep148–165, on Ang II stimulation of TH and DβH immunoreactivities and [3H]NE uptake in neurons. pep148–165 or its mut148–165 was osmotically loaded, followed by incubation of the cells with 100 nM Ang II for 4 h as described in Materials and Methods. Synaptosomal preparations were used to measure the TH (A) and DβH (B) proteins, and [3H]NE uptake (C) as described in legend to Fig. 1. A and B, (top) represent autoradiograms. Bottom in A and B represent mean data ± SE (n = 3). Data in C are mean ± SE (n = 3). *, significantly different (P < 0.01) from the control. **, significantly different (P < 0.01) from Ang II–treated neurons.

Similar articles

Cited by

References

    1. Aderem A. The MARCKS family of protein kinase-C substrates. Biochem Soc Trans. 1995;23:587–591. - PubMed
    1. Ahmad F, Li PM, Meyerovitch J, Goldstein BJ. Osmotic loading of neutralizing antibodies demonstrates a role for protein-tyrosine phosphatase 1B in negative regulation of the insulin action pathway. J Biol Chem. 1995;270:20503–20508. - PubMed
    1. Aigner L, Caroni P. Depletion of 43-kD growth-associated protein in primary sensory neurons leads to diminished formation and spreading of growth cones. J Cell Biol. 1993;123:417–429. - PMC - PubMed
    1. Allen LA, Aderem A. Protein kinase C regulates MARCKS cycling between the plasma membrane and lysosomes in fibroblasts. EMBO (Eur Mol Biol Organ) J. 1995;14:1109–1120. - PMC - PubMed
    1. Amess B, Manjarrez-Hernandex HA, Howell SA, Learmonth M, Aitken A. Multisite phosphorylation of the 80 kDa (MARCKS) protein kinase C substrate in C3H/10T1/Z fibroblasts, quantitative analysis of individual sites by solid-phase microsequencing. FEBS (Fed Eur Biochem Soc) Lett. 1992;297:285–291. - PubMed

MeSH terms