. 1998 Jul 13;142(1):241-50.
doi: 10.1083/jcb.142.1.241.

The FGF receptor-1 tyrosine kinase domain regulates myogenesis but is not sufficient to stimulate proliferation

Affiliations

The FGF receptor-1 tyrosine kinase domain regulates myogenesis but is not sufficient to stimulate proliferation

A J Kudla et al. J Cell Biol. .

Abstract

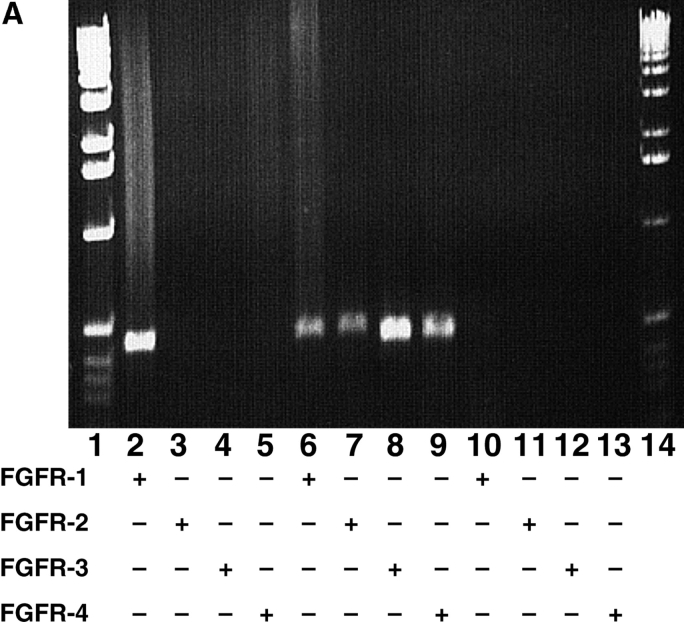
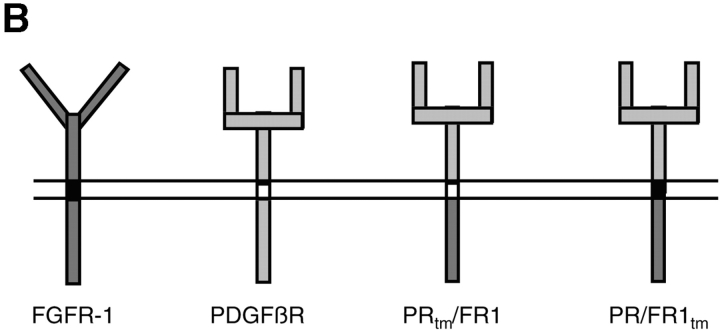
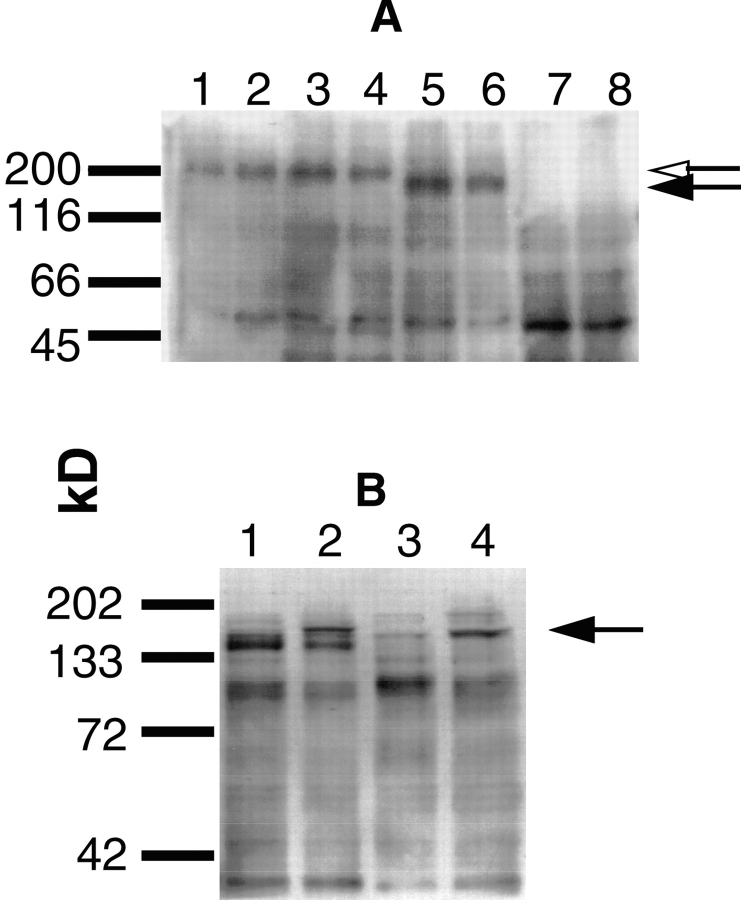
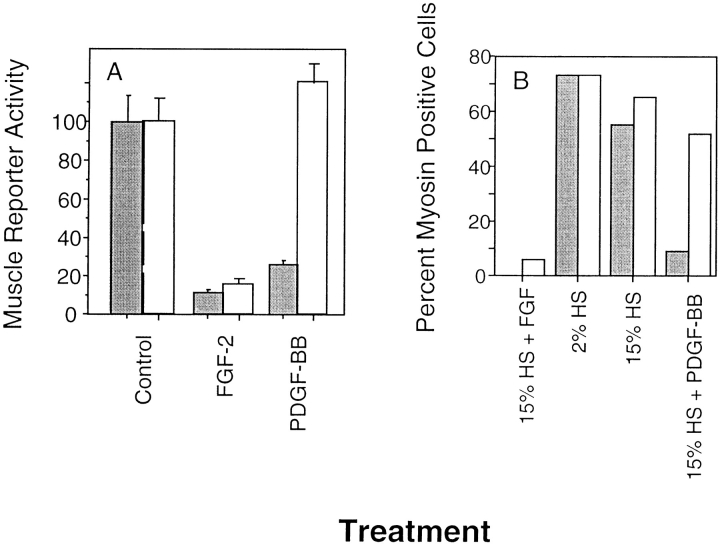
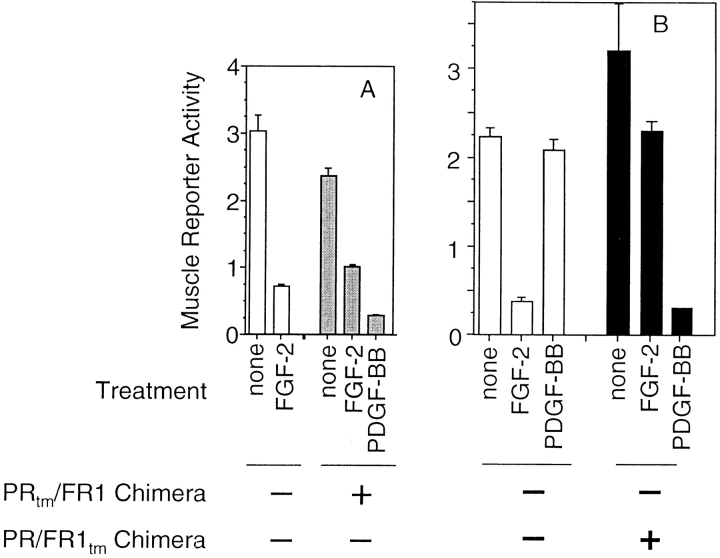
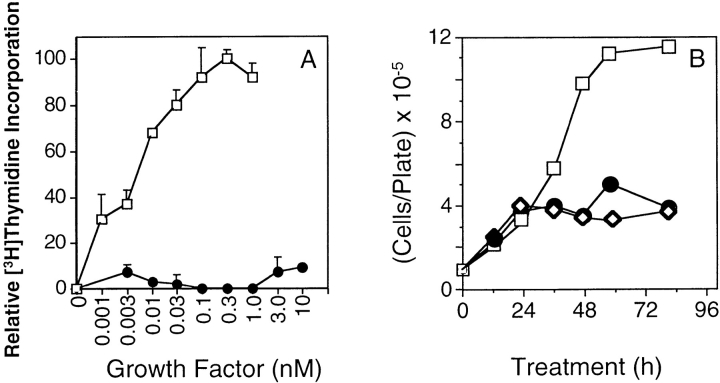
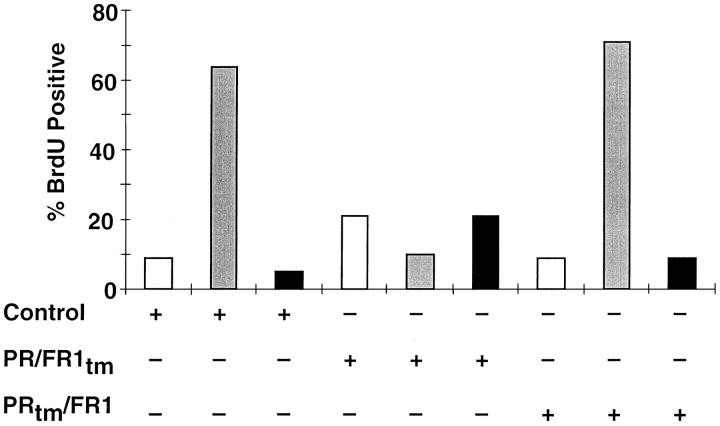
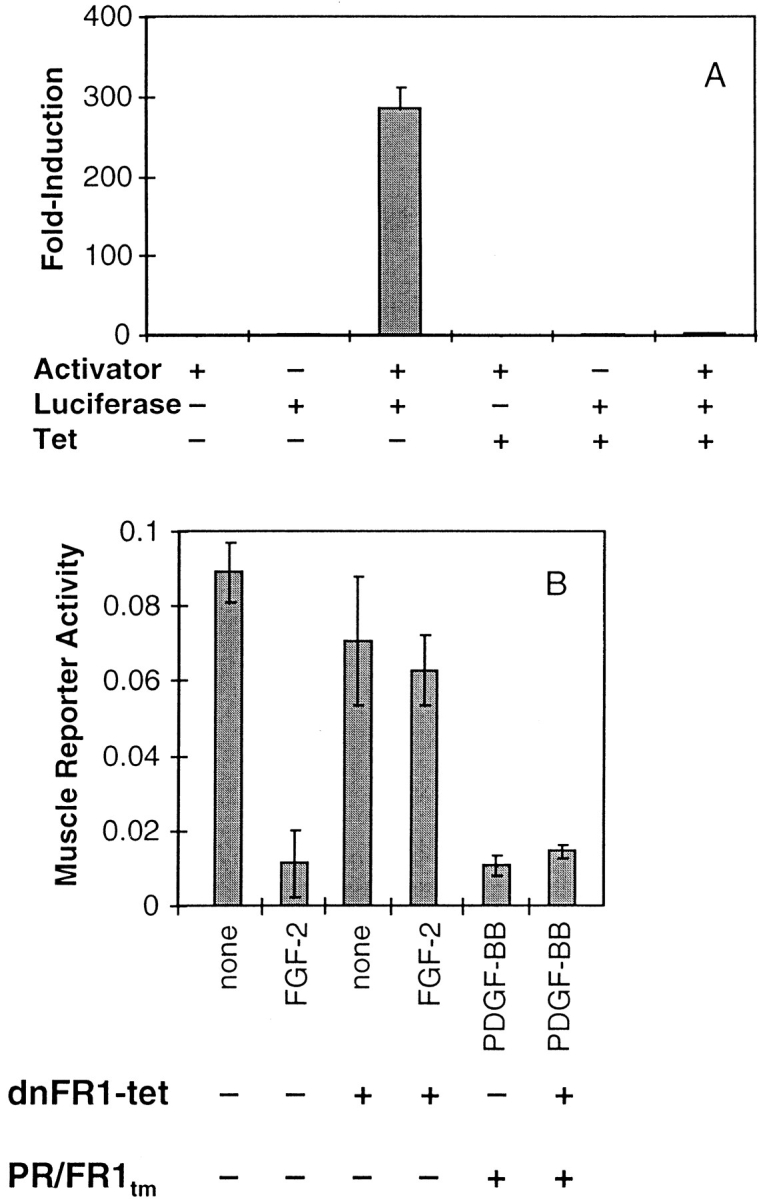
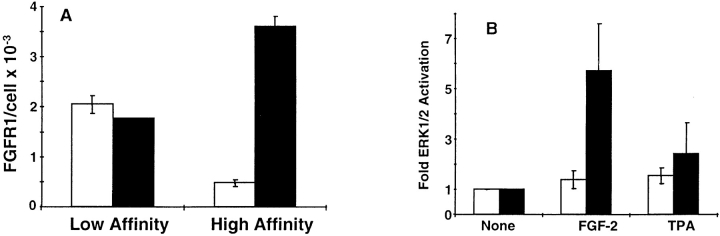
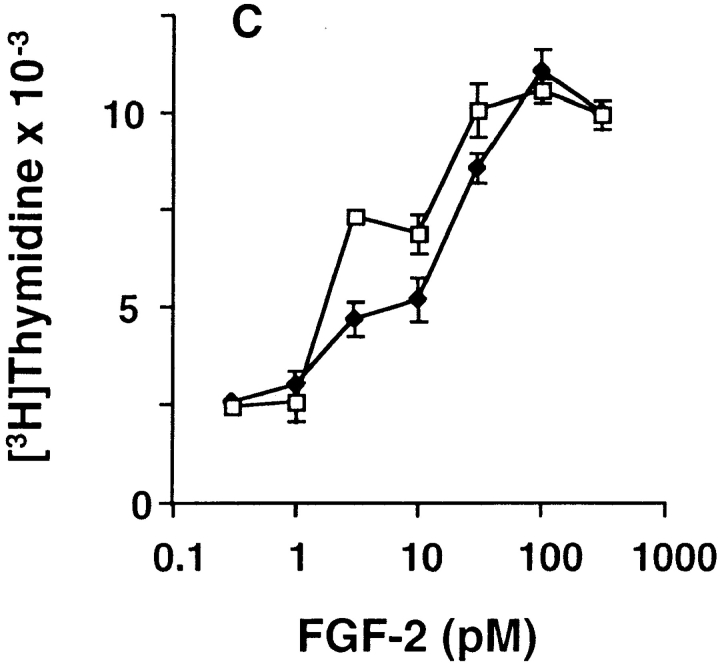
Ligand-stimulated activation of FGF receptors (FGFRs) in skeletal muscle cells represses terminal myogenic differentiation. Skeletal muscle cell lines and subsets of primary cells are dependent on FGFs to repress myogenesis and maintain growth. To understand the intracellular events that transduce these signals, MM14 skeletal muscle cells were transfected with expression vectors encoding chimeric receptors. The chimeras are comprised of the PDGF beta receptor (PDGFbetaR) extracellular domain, the FGFR-1 intracellular domain, and either the PDGFbetaR or FGFR-1 transmembrane domain. The chimeric receptors were autophosphorylated upon PDGF-BB stimulation and are capable of stimulating mitogen-activated protein kinase activity. Activation of the tyrosine kinase domain of either chimera repressed myogenesis, suggesting intracellular responses regulating skeletal muscle differentiation are transduced by activation of the FGFR-1 tyrosine kinase. Unexpectedly, we found that activation of either chimeric receptor failed to stimulate cellular proliferation. Thus, it appears that regulation of skeletal muscle differentiation by FGFs requires only activation of the FGFR tyrosine kinase. In contrast, stimulation of proliferation may require additional, as yet unidentified, signals involving the receptor ectodomain, the FGF ligand, and heparan sulfate either alone, or in combination.


Figures

Figure 1
Figure 1
FGFR expression and receptor chimeras. (A) RT-PCR analysis of FGFR expression in MM14 cells. RT-PCR of total RNA from MM14 cells demonstrates that these cells detectably express only FGFR-1. RT-PCR analysis included either RNA prepared from MM14 cells (lanes 2–5); plasmid DNAs for FGFR-1 (lane 6), FGFR-2 (lane 7); total RNA prepared from embryonic stem cell tumors (lanes 8 and 9); and a no DNA control (lanes 10–13). Lanes 1 and 14 contain a 1-kb ladder. Specific primers for FGFR-1, FGFR-2, FGFR-3, and FGFR-4 were used as indicated in the figure. (B) The biological activities of four different receptors were examined in MM14 cells and include FGFR-1, PDGFβR, the PRtm/FR1 chimera containing the PDGFβR extracellular (light gray), transmembrane (white) domains, the FGFR-1 intracellular (dark gray) domain, and the PR/FR1tm chimera containing the PDGFβR extracellular domain (light gray), the FGFR-1 transmembrane (black), and intracellular domain (dark gray).
Figure 1
Figure 1
FGFR expression and receptor chimeras. (A) RT-PCR analysis of FGFR expression in MM14 cells. RT-PCR of total RNA from MM14 cells demonstrates that these cells detectably express only FGFR-1. RT-PCR analysis included either RNA prepared from MM14 cells (lanes 2–5); plasmid DNAs for FGFR-1 (lane 6), FGFR-2 (lane 7); total RNA prepared from embryonic stem cell tumors (lanes 8 and 9); and a no DNA control (lanes 10–13). Lanes 1 and 14 contain a 1-kb ladder. Specific primers for FGFR-1, FGFR-2, FGFR-3, and FGFR-4 were used as indicated in the figure. (B) The biological activities of four different receptors were examined in MM14 cells and include FGFR-1, PDGFβR, the PRtm/FR1 chimera containing the PDGFβR extracellular (light gray), transmembrane (white) domains, the FGFR-1 intracellular (dark gray) domain, and the PR/FR1tm chimera containing the PDGFβR extracellular domain (light gray), the FGFR-1 transmembrane (black), and intracellular domain (dark gray).
Figure 2
Figure 2
Chimeric receptor expression and activity. (A) Western blot analysis of the PDGFβR and the PRtm/FR1 chimera. MM14 cells stably expressing the introduced PDGFβR (lanes 1 and 2), human fibroblasts expressing endogenous PDGFβR (lanes 3 and 4), MM14 cells expressing the PRtm/FR1 chimera (lanes 5 and 6), and untransfected MM14 cells (lanes 7 and 8) were separated by SDS-PAGE, blotted, and then stained with an anti-PDGFβR mAb (lanes 1–8). The solid arrowhead indicates the migration of the PRtm/FR1 chimera and the open arrowhead indicates the migration of the PDGFβR. (B) PDGF-BB–stimulated tyrosine phosphorylation in MM14 cells stably expressing PRtm/FR1. Proliferating (lanes 1 and 2) and differentiated (lanes 3 and 4) cells were left unstimulated (lanes 1 and 3) or were stimulated with 2 nM PDGF-BB (lanes 2 and 4) for 10 min. An anti-phosphotyrosine immunoblot analysis of equal amounts of detergent-solubilized cell extracts is shown. The arrow indicates the position of migration of the tyrosine-phosphorylated chimeric receptor after PDGF-BB stimulation of both proliferating and differentiated cells. The migration of molecular weight markers is indicated on the left.
Figure 3
Figure 3
Stably expressed PRtm/FR1 chimeric receptors repress differentiation. (A) PDGF-BB represses skeletal muscle-specific gene expression in PRtm/FR1 cells. MM14 cells stably expressing PRtm/FR1 were transiently transfected with a differentiated muscle-specific gene reporter (α-cardiac actin luciferase). Cells transfected with the empty vector (white) or the PRtm/FR1 expression construct (gray) were left untreated (Control), treated with FGF-2, or treated with PDGF-BB. Data are represented as a percent of the control activity. Error bars represent the standard deviation of triplicate analyses. (B) PDGF-BB represses skeletal muscle differentiation in MM14 cells stably expressing the PRtm/FR1 chimeric receptor. MM14 cells transfected with a control vector (the expression plasmid minus the receptor chimera cDNA; white) or the PRtm/FR1 chimera (gray) exhibit a low number of myosin positive cells in the presence of FGF. In the absence of growth factors, cells were maintained in the presence of anti-PDGFβR and anti–FGF-2 antibodies as previously described (16) to reduce stimulation from serum-derived PDGF-BB and residual FGF-2, respectively. Maximum levels of MHC-positive cells are observed in 2% horse serum in the absence of FGF. Each data point is the average of duplicate plates from a representative experiment with an average of 1,500 cells scored for each plate. The number of myosin-positive cells in the presence of FGF (gray bar, 15% HS + FGF) was 0% and thus is too low a value to be observable on the histogram.
Figure 4
Figure 4
Transiently expressed PRtm/FR1 and PR/FR1tm receptor chimeras repress differentiation. (A) PDGF-BB inhibits myogenic differentiation in cells transiently transfected with an expression vector encoding the PRtm/FR1 receptor chimera. MM14 cells were transfected with expression vectors encoding the PRtm/ FR1 receptor chimera (gray) or a control vector (white), a muscle-specific luciferase reporter and a constitutively active LacZ reporter. Cultures were left untreated or fed at 12-h intervals with increasing concentrations (1–2 nM) of FGF-2 or PDGF-BB. At 36 h, the cells were harvested and assayed for luciferase and β-galactosidase activity. (B) PDGF-BB inhibits myogenic differentiation in cells transiently transfected with an expression vector encoding the PR/FR1tm receptor chimera. MM14 cells were transfected with expression vectors encoding the PR/FR1tm receptor chimera (black) or a control vector (white), a muscle-specific luciferase reporter and a constitutively active LacZ reporter. Cells were treated, harvested, and assayed as described for A.
Figure 5
Figure 5
Chimeric receptors fail to stimulate DNA synthesis or cell growth. (A) PDGF-BB does not block cell cycle exit in MM14 cells stably expressing the PRtm/FR1 receptor chimera. Cells expressing PRtm/FR1 were cultured in the indicated concentrations of either FGF-2 (□) or PDGF-BB (•) for 18 h. [3H]Thymidine was then added and the amount of [3H]thymidine incorporated was determined after 10 h. Error bars represent the standard deviation of triplicate points. (B) PDGF-BB does not stimulate cell growth in MM14 cells stably expressing the PRtm/ FR1 receptor chimera. Equal numbers of MM14 cells expressing the PRtm/FR1 receptor were grown for 24 h, and then switched to media and 15% horse serum containing no growth factors (⋄), or fed at 12-h intervals with increasing concentrations (0.5–2 nM) of FGF-2 (□), or PDGF-BB (•). At the indicated times the number of cells per 100-mm2 plate were scored.
Figure 6
Figure 6
Single cell analysis of transiently expressed chimeric receptors. Quantitative analysis of BrdU incorporation. MM14 cells transiently co-transfected with an empty expression vector, or PRtm/FR1, or PR/FR1tm, and a CMV-LacZ expression vector were either left untreated (white), or treated with 200 pM FGF-2 (gray), or 1 nM PDGF-BB (black) after transfection. β-Galactosidase–positive cells were scored for BrdU incorporation and the percent of BrdU-positive cells plotted. A minimum of 200 β-galactosidase–positive cells were scored for each coverslip. One representative experiment is shown. The experiment was repeated with similar results.
Figure 7
Figure 7
ERK activation by receptor chimeras in MM14 cells. (A) Proliferating MM14 cells stably expressing PRtm/FR1 were starved and then stimulated for 10 min as indicated. Cell lysates were prepared and ERK1/2 proteins were immunoprecipitated. Immune complexes were subjected to an in vitro kinase assay and the reaction products resolved by SDS-PAGE. Incorporation of 32P was quantified by phosphoimage analysis. The inset illustrates a representative example from the gel analysis (N, F, P, and T correspond to None, FGF-2, PDGF-BB, and TPA, respectively.) Error bars represent the standard deviation of three independent samples. (B) Cells transiently expressing the PR/FR1tm chimera activate an elk reporter gene. MM14 cells transiently co-transfected with the PR/FR1tm chimera, an elk reporter, and a constitutively expressed LacZ construct were either left untreated (black), stimulated with FGF-2 (white), or PDGF-BB (gray).
Figure 8
Figure 8
Signaling mediated by the chimeric receptors is not mediated via an indirect autocrine FGF response. (A) Luciferase expression is induced nearly 300-fold in MM14 cells transiently transfected with both the tetracycline activator construct and the tetracycline activator–responsive luciferase reporter construct relative to cells transfected only with the reporter construct. MM14 cells were transiently co-transfected with a LacZ expression construct (CMV-LacZ) along with the tetracycline activator construct (Activator), the luciferase reporter construct under the control of the tetracycline activator (Luciferase), and then cultured in the presence or absence of tetracycline (Tet; 1 μg/ml) for 36 h, harvested and then assayed for luciferase and β-galactosidase activities. (B) MM14 cells were transiently co-transfected with a muscle-specific luciferase reporter gene, CMV-LacZ, the tetracycline activator construct and/or dnFR1-tet, which encodes a dominant-negative FGFR-1 mutant under the control of the tetracycline activator, and where indicated, PR/FR1tm. All cultures were maintained in the absence of tetracycline and received either no treatment, FGF-2 (1 nM), or PDGF-BB (2 nM). After 36 h, the luciferase and β-galactosidase activities were measured to determine muscle-specific promoter activity. Error bars represent the standard deviation of triplicate points. All data shown are from cells incubated in the absence of tetracycline.
Figure 9
Figure 9
Overexpression of FGFR-1 enhances ERK1/2 stimulation but fails to affect proliferation. MM14 cells were stably transfected with an FGFR-1 expression vector. MM14 cells overexpressing FGFR-1 (black) were compared with parental cells (white) for FGF-2 binding (A), ERK1/2 activity (B), and DNA synthesis (C). (A) Equilibrium binding was performed using 125I-labeled FGF-2 as described in Materials and Methods. High and low affinity sites were revealed by washing intact cells with high salt or high salt/low pH buffers, respectively. (B) ERK 1/2 activity was determined using myelin basic protein as a substrate for parental (white) and FGFR-1 overexpressing cells (black). Cells were stimulated with DMSO (none), 100 pM FGF-2, or 100 nM TPA for 10 min and then assayed as described in Materials and Methods. The reaction products were resolved by SDS-PAGE and radiolabeled MBP quantified by phosphoimage analysis. The values for DMSO treatment were normalized to 1.0 to compare the two cell lines. Error bars indicate standard deviation. (C) DNA synthesis was examined in parental MM14 cells (□) and MM14-FR1 cells incubated (♦) with increasing concentrations of FGF-2 using a cell proliferation assay as described in Materials and Methods. The results are the representative of a single experiment. Each determination was repeated twice with similar results.
Figure 9
Figure 9
Overexpression of FGFR-1 enhances ERK1/2 stimulation but fails to affect proliferation. MM14 cells were stably transfected with an FGFR-1 expression vector. MM14 cells overexpressing FGFR-1 (black) were compared with parental cells (white) for FGF-2 binding (A), ERK1/2 activity (B), and DNA synthesis (C). (A) Equilibrium binding was performed using 125I-labeled FGF-2 as described in Materials and Methods. High and low affinity sites were revealed by washing intact cells with high salt or high salt/low pH buffers, respectively. (B) ERK 1/2 activity was determined using myelin basic protein as a substrate for parental (white) and FGFR-1 overexpressing cells (black). Cells were stimulated with DMSO (none), 100 pM FGF-2, or 100 nM TPA for 10 min and then assayed as described in Materials and Methods. The reaction products were resolved by SDS-PAGE and radiolabeled MBP quantified by phosphoimage analysis. The values for DMSO treatment were normalized to 1.0 to compare the two cell lines. Error bars indicate standard deviation. (C) DNA synthesis was examined in parental MM14 cells (□) and MM14-FR1 cells incubated (♦) with increasing concentrations of FGF-2 using a cell proliferation assay as described in Materials and Methods. The results are the representative of a single experiment. Each determination was repeated twice with similar results.

Similar articles

Cited by

References

    1. Baldin V, Roman AM, Bosc BI, Amalric F, Bouche G. Translocation of bFGF to the nucleus is G1 phase cell cycle specific in bovine aortic endothelial cells. EMBO (Eur Mol Biol Organ) J. 1990;9:1511–1517. - PMC - PubMed
    1. Bargmann CI, Hung MC, Weinberg RA. Multiple independent activations of the neu oncogene by a point mutation altering the transmembrane domain of p185. Cell. 1986;45:649–57. - PubMed
    1. Bargmann CI, Weinberg RA. Increased tyrosine kinase activity associated with the protein encoded by the activated neu oncogene. Proc Natl Acad Sci USA. 1988;85:5394–5398. - PMC - PubMed
    1. Bouche G, Gas N, Prats H, Baldin V, Tauber JP, Teissie J, Amalric F. Basic fibroblast growth factor enters the nucleolus and stimulates the transcription of ribosomal genes in ABAE cells undergoing G0-G1 transition. Proc Natl Acad Sci USA. 1987;84:6770–6774. - PMC - PubMed
    1. Burgess WH, Shaheen AM, Ravera M, Jaye M, Donohue PJ, Winkles JA. Possible dissociation of the heparin-binding and mitogenic activities of heparin-binding (acidic fibroblast) growth factor-1 from its receptor-binding activities by site-directed mutagenesis of a single lysine residue. J Cell Biol. 1990;111:2129–2138. - PMC - PubMed

Publication types

MeSH terms

Substances