. 1998 Aug 1;510 ( Pt 3)(Pt 3):829-43.
doi: 10.1111/j.1469-7793.1998.829bj.x.

Characterization of sensory and corticothalamic excitatory inputs to rat thalamocortical neurones in vitro

Affiliations

Characterization of sensory and corticothalamic excitatory inputs to rat thalamocortical neurones in vitro

J P Turner et al. J Physiol. .

Abstract

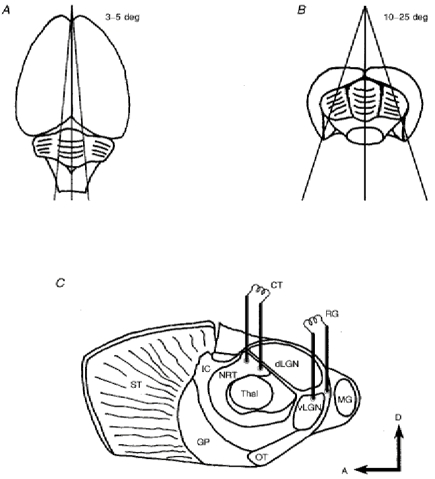
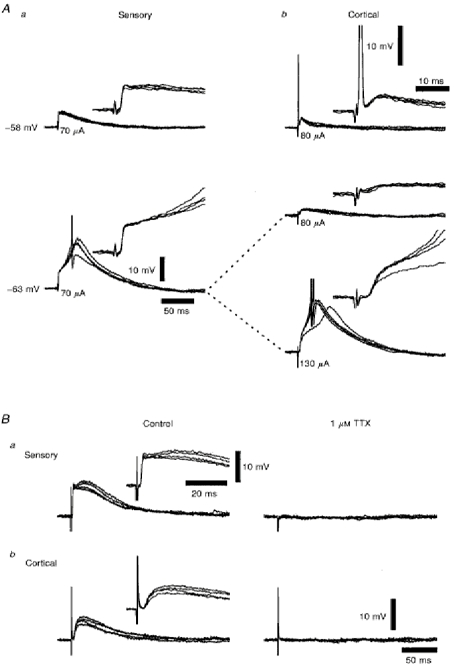
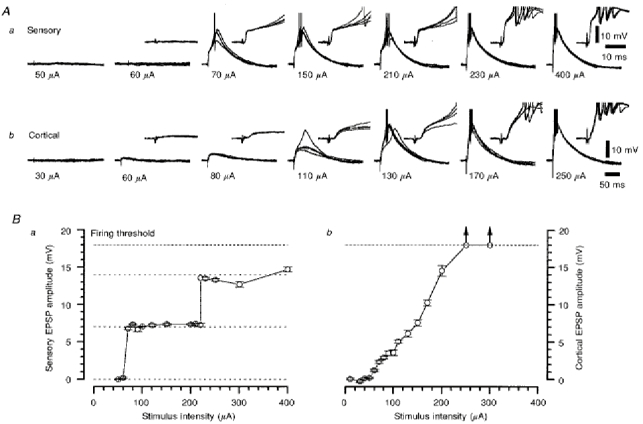
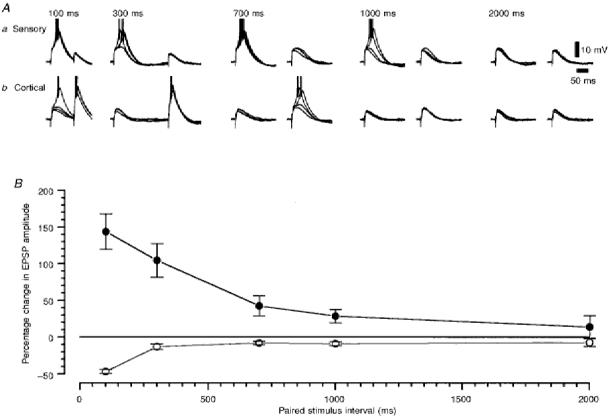
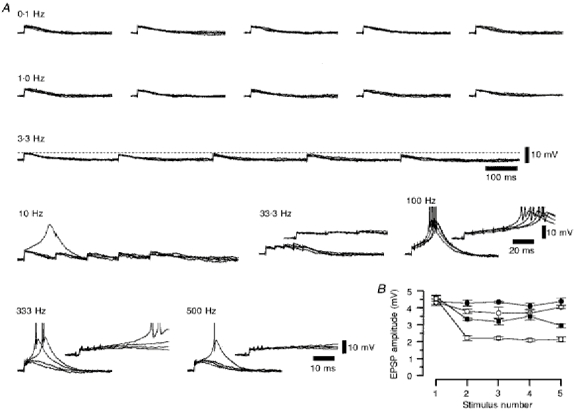
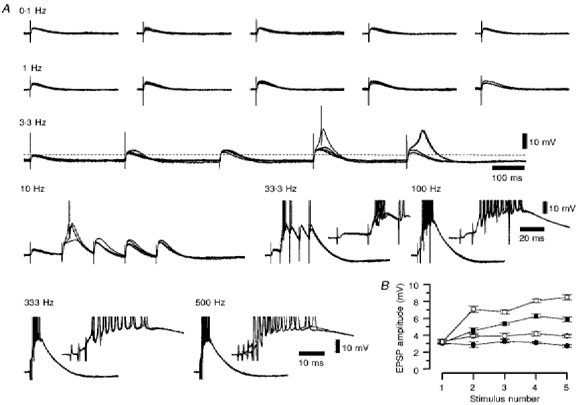
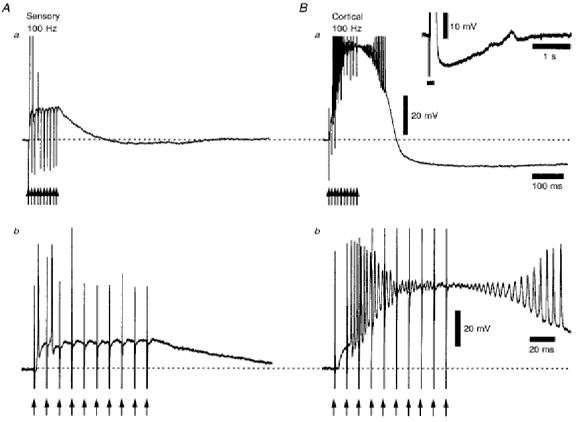
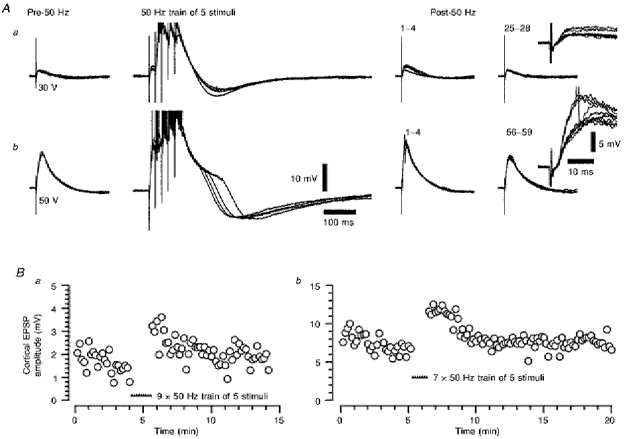
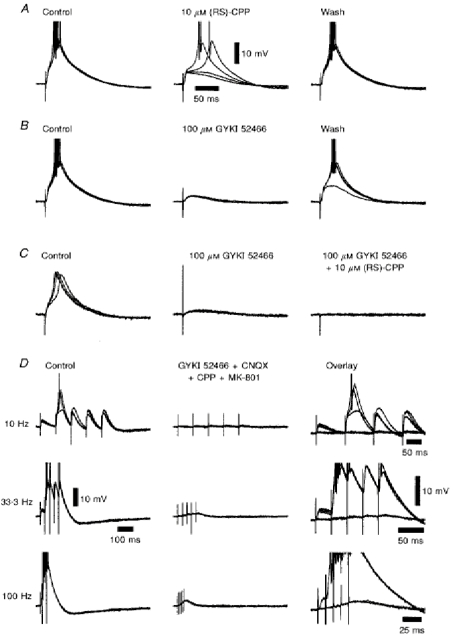
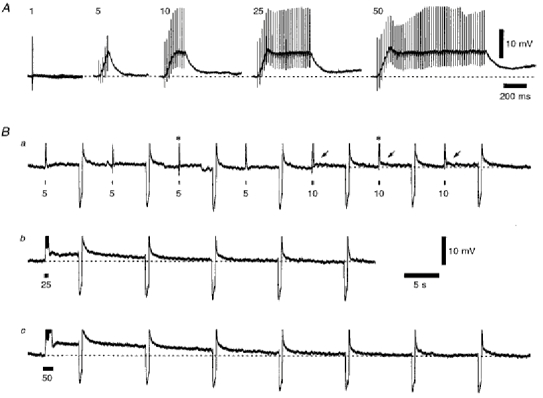
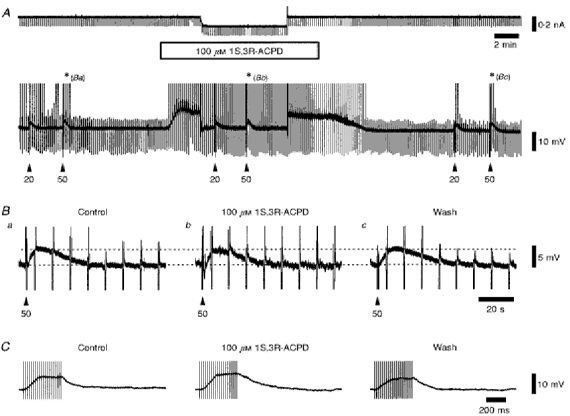
1. Using an in vitro slice preparation of the rat dorsal lateral geniculate nucleus (dLGN), the properties of retinogeniculate and corticothalamic inputs to thalamocortical (TC) neurones were examined in the absence of GABAergic inhibition. 2. The retinogeniculate EPSP evoked at low frequency (>= 0.1 Hz) consisted of one or two fast-rising (0.8 +/- 0.1 ms), large-amplitude (10.3 +/- 1.6 mV) unitary events, while the corticothalamic EPSP had a graded relationship with stimulus intensity, owing to its slower-rising (2.9 +/- 0.4 ms), smaller-amplitude (1.3 +/- 0.3 mV) estimated unitary components. 3. The retinogeniculate EPSP exhibited a paired-pulse depression of 60.3 +/- 5.6 % at 10 Hz, while the corticothalamic EPSP exhibited a paired-pulse facilitation of > 150 %. This frequency-dependent depression of the retinogeniculate EPSP was maximal after the second stimulus, while the frequency-dependent facilitation of the corticothalamic EPSP was maximal after the fourth or fifth stimulus, at interstimulus frequencies of 1-10 Hz. 4. There was a short-term enhancement of the >= 0.1 Hz corticothalamic EPSP (64.6 +/- 9.2 %), but not the retinogeniculate EPSP, following trains of stimuli at 50 Hz. 5. The >= 0.1 Hz corticothalamic EPSP was markedly depressed by the non-NMDA antagonist 1-(4-amino-phenyl)-4-methyl-7,8-methylene-dioxy-5H-2, 3-benzodiazepine (GYKI 52466), but only modestly by the NMDA antagonist 3-((RS)-2-carboxypiperazin-4-yl)-propyl-1-phosphonic acid ((RS)-CPP), and completely blocked by the co-application of GYKI 52466, 6-cyano-7-nitroquinoxaline-2,3-dione (CNQX), (RS)-CPP and (5R, 10S)-(+)-5-methyl-10,11-dihydro-5H-dibenzo[a,d]cyclohepten-5, 10-imine (MK-801). Likewise, the corticothalamic responses to trains of stimuli (1-500 Hz) were greatly reduced by this combination of ionotropic glutamate receptor antagonists. 6. In the presence of GYKI 52466, CNQX, (RS)-CPP and MK-801, residual corticothalamic responses and slow EPSPs, with a time to peak of 2-10 s, could be generated following trains of five to fifty stimuli. Neither of these responses were occluded by 1S,3R-1-aminocyclopentane-1, 3-dicarboxylic acid (1S,3R-ACPD), suggesting they are not mediated via group I and II metabotropic glutamate receptors.


Figures

Figure 1
Figure 1. The preparation of rat mid-brain slices containing the dLGN and maintaining the continuity of retinogeniculate and corticothalamic fibre inputs
A and B, the dorsal and caudal views of the rat brain, respectively, showing the position and angle of the two initial cuts used to produce the blocks of brain tissue for subsequent slice preparation. C, the locations of the stimulating electrodes required to activate retinogeniculate and corticothalamic fibre inputs and evoke EPSPs in the dLGN TC neurones of rat mid-brain slices cut at the angles illustrated in A and B. Abbreviations: A, anterior; CT, corticothalamic; D, dorsal; dLGN, dorsal lateral geniculate nucleus; GP, globus pallidus; IC, internal capsule; MG, medial geniculate nucleus; NRT, nucleus reticularis thalami; OT, optic tract; RG, retinogeniculate; ST, striatum; Thal, main field of the thalamus; vLGN, ventral lateral geniculate nucleus.
Figure 2
Figure 2. The EPSPs recorded from a dLGN TC neurone when stimulating the retinogeniculate and corticothalamic fibres in the same slice, and their dependence on action potential propagation
Aa and b, two series of four superimposed voltage records showing that both retinogeniculate (a) and corticothalamic (b) EPSPs were able to evoke LTCPs at resting membrane potential (-63 mV), and that the stimulation of corticothalamic fibres (80 μA) could evoke an antidromic spike at a more depolarized membrane potential (-58 mV), indicating the continuity of thalamocortical fibres to the stimulation site. The insets illustrate the onset of the EPSPs and the antidromic spikes over a shorter time course. Spike amplitudes have been truncated for clarity. Stimulus intensities are denoted below each set of traces. Firing threshold was -45 mV. Ba and b, two series of four superimposed voltage records of retinogeniculate (a) and corticothalamic (b) EPSPs in the absence and presence of 1 μm TTX, illustrating their dependence on the Na+ current which underlies the action potential. The insets illustrate the onset and rising phase of the EPSPs over a shorter time course. Membrane potential was -64 mV.
Figure 3
Figure 3. Characterization of the retinogeniculate and corticothalamic EPSPs recorded from the same TC neurone
Aa and b, two series of four superimposed voltage records of retinogeniculate (a) and corticothalamic (b) EPSPs evoked at the stimulus intensities denoted below each set of traces. The insets illustrate the onset and rising phase of the EPSPs over a shorter time course. Action potentials have been truncated for clarity. Membrane potential was -70 mV. Ba and b, the stimulus intensity-EPSP amplitude response relationships for the retinogeniculate (a) and corticothalamic (b) EPSPs, as constructed from the data shown in Aa and Ab, respectively. The arrows indicate that at these stimulus intensities, the corticothalamic EPSP was suprathreshold at the time at which the peak measurement was made.
Figure 4
Figure 4. The paired-pulse properties of retinogeniculate and corticothalamic EPSPs recorded from the same TC neurone
A, two series of four superimposed voltage records of retinogeniculate (a) and corticothalamic (b) EPSPs evoked by pairs of stimuli at the time intervals indicated at the top of the panel. Action potentials have been truncated for clarity. Membrane potential was -77 mV. B, the paired stimulus interval-percentage change in EPSP amplitude relationship for the retinogeniculate and corticothalamic EPSPs, as constructed from the data shown in A. ^, sensory; •, cortical.
Figure 5
Figure 5. The frequency-dependent depression for a series of five consecutive retinogeniculate EPSPs evoked at frequencies between 0.1 and 500 Hz
A, a series of four superimposed voltage records of the retinogeniculate EPSPs evoked by five stimuli at the frequency denoted above each set of traces. The insets illustrate the temporal summation of the depressed retinogeniculate EPSP with increasing frequency. Action potentials have been truncated for clarity. Membrane potential was -67 mV. B, a graph showing the change in retinogeniculate EPSP amplitude with increasing stimulus number, constructed from the data shown in A. •, 0.10 Hz; ^, 1.00 Hz; ▪, 3.33 Hz; □, 10.0 Hz.
Figure 6
Figure 6. The frequency-dependent facilitation for a series of five consecutive corticothalamic EPSPs evoked at frequencies between 0.1 and 500 Hz
A, a series of four superimposed voltage records of the corticothalamic EPSPs evoked by five stimuli at the frequency denoted above each set of traces. The insets illustrate that there is a very robust wind-up of the corticothalamic EPSP with increasing frequency. Action potentials have been truncated for clarity. Membrane potential was -68 mV. B, a graph showing the change in corticothalamic EPSP amplitude with increasing stimulus number, constructed from the data in shown A. •, 0.10 Hz; ^, 1.00 Hz; ▪, 3.33 Hz; □, 10.0 Hz.
Figure 7
Figure 7. Retinogeniculate and corticothalamic responses to trains of ten stimuli at 100 Hz recorded from the same TC neurone
Aa and b, single-voltage records of the retinogeniculate response, which was suprathreshold until the third stimulus (Ab). Following the offset of the stimulus train, there was a small after-hyperpolarization following repolarization of membrane potential (Aa). Ba and b, single-voltage records of the corticothalamic response, which was subthreshold after the first stimulus, but became more depolarized with each successive stimulus (Bb). The action potentials evoked after the second stimulus became diminished in amplitude during this depolarization, recovering their height during the repolarization of membrane potential at the offset of the stimulus train. Following this response, there was a pronounced long-lasting after-hyperpolarization (Ba), the full time course of which is shown in the inset, where the horizontal filled bar is the time period of the stimulus train. The arrows indicate the times of stimulation during the train. Action potentials in Aa and Ba have been truncated for clarity. Membrane potential was -61 mV.
Figure 8
Figure 8. The short-term potentiation of the low-frequency corticothalamic EPSP following trains of five stimuli at 50 Hz
Aa and b, two series of four superimposed voltage responses illustrating the potentiation of a relatively small (Aa) and a relatively large EPSP (Ab) recorded from the same TC neurone, and the probable lack of dependence on whether a LTCP was evoked by the EPSP or the voltage excursion during the 50 Hz stimulation. The numbers above the post-50 Hz records denote the low-frequency stimulus number after the last 50 Hz train. All low-frequency stimulation voltage records have been overlaid in the insets on the right of these series. Note the difference in the repolarizing phase of the responses to the trains of five stimuli between 30 and 50 V stimulation, probably reflecting the differential activation of suprathreshold voltage-dependent conductances by the response to 50 V stimulation. Action potentials have been truncated for clarity. Membrane potential was -64 mV. Ba and b, the time course of the potentiation of the corticothalamic EPSP by 50 Hz stimulation from Aa and Ab, respectively. Filled triangles indicate the times of stimulus trains.
Figure 9
Figure 9. The ionotropic glutamate receptor pharmacology of the corticothalamic EPSP
A, a series of four superimposed voltage records illustrating the small depression of the corticothalamic EPSP caused by the NMDA antagonist (RS)-CPP. B, a further series of four superimposed voltage records, recorded from the same TC neurone, illustrating the marked depression of the corticothalamic EPSP caused by the non-NMDA antagonist GYKI 52466. C, a series of four superimposed voltage records from a different TC neurone illustrating the sequential depression of the corticothalamic EPSP by GYKI 52466, and the remaining slower EPSP (obtained in the presence of GYKI 52466) by (RS)-CPP, resulting in a complete suppression of the corticothalamic response. The calibration bars in A also apply to B and C.D, three series of four superimposed voltage records in the absence and presence of 20 μm CNQX, 100 μm GYKI 52466, 10 μm (RS)-CPP and 3 μm MK-801, plus an overlay of all records at each frequency, illustrating the depression of the facilitated corticothalamic response to trains of five stimuli between 10 and 100 Hz by a combination of ionotropic glutamate receptor antagonists. Action potentials have been truncated for clarity. Membrane potential was -69 mV in both A and B, -67 mV in C, and -68 mV in D.
Figure 10
Figure 10. The residual response and slow EPSP evoked by stimulation of corticothalamic fibres, using a series of trains at 50 Hz, in the presence of a combination of ionotropic glutamate receptor antagonists
A, on the left are four superimposed voltage records to a single stimulus, followed by a series of individual voltage records evoked by an increasing number of stimuli at 50 Hz, illustrating the development of the residual wind-up of the corticothalamic response in the presence of 20 μm CNQX, 100 μm GYKI 52466, 10 μm (RS)-CPP and 3 μm MK-801. The vertical deflections are the stimulus artefacts. Ba-c, a series of individual voltage records from the same TC neurone, but on a longer time scale, illustrating the development of the slow EPSP after the residual responses illustrated in A. The horizontal filled bars indicate the time period of each stimulus train, and the asterisks in Ba denote the residual responses to five and ten stimuli illustrated in A. The arrows in Ba highlight the small slow EPSPs evoked by ten stimuli. Membrane potential was -64 mV.
Figure 11
Figure 11. The slow EPSP and residual response to corticothalamic fibre stimulation in a combination of ionotropic glutamate antagonists, and the effect of the group I and II mGluR agonist 1S,3R-ACPD
A, continuous current and voltage records in the absence and presence of 100 μm 1S,3R-ACPD, while in the constant presence of 20 μm CNQX, 100 μm GYKI 52466, 10 μm (RS)-CPP and 3 μm MK-801. The upward deflections on the voltage record are the LTCPs generated at the offset of the current pulse, some of which evoke action potentials. These have been truncated for clarity. The voltage artefacts of the stimulus trains are marked by the arrowheads. Ba-c, a series of individual voltage records illustrating the amplitude and time course of the slow corticothalamic EPSP before, during and after the application of 1S,3R-ACPD, as illustrated by the asterisks in A, showing the lack of occlusion by the mGluR agonist. The downward deflections are the voltage responses to injected current, as shown in A, and the upward deflections are as described for A, except for the stimulus artefact as indicated by the arrowheads. Membrane potential was -67 mV. C, a series of individual voltage records illustrating the residual corticothalamic response to twenty stimuli at 50 Hz, and the lack of occlusion of this response by 100 μm 1S,3R-ACPD in the presence of 20 μm CNQX, 100 μm GYKI 52466, 10 μm (RS)-CPP and 3 μm MK-801. The vertical deflections are the stimulus artefacts. Membrane potential was -61 mV.

Similar articles

Cited by

References

    1. Aghajanian GK, Rasmussen K. Intracellular studies in the facial nucleus illustrating a simple new method for obtaining viable motoneurons in adult rat brain slices. Synapse. 1989;3:331–338. - PubMed
    1. Bloomfield SA, Sherman SM. Postsynaptic potentials recorded in neurons of the cat's lateral geniculate nucleus following electrical stimulation of the optic chiasm. Journal of Neurophysiology. 1988;60:1924–1945. - PubMed
    1. Bourassa J, Deschênes M. Corticothalamic projections from the primary visual cortex in rats: a single fiber study using biocytin as an antegrade tracer. Neuroscience. 1995;66:253–263. - PubMed
    1. Castro-Alamancos MA, Landisman CE, Connors BW. Mechanisms of facilitation at corticothalamic synapses in the ventrobasal thalamus. Society for Neuroscience Abstracts. 1997;23:230.5.
    1. Contreras D, Destexhe A, Sejnowski TJ, Steriade M. Control of spatiotemporal coherence of a thalamic oscillation by corticothalamic feedback. Science. 1996;274:771–774. - PubMed

Publication types

MeSH terms

Substances

LinkOut - more resources