

Locus of frequency-dependent depression identified with multiple-probability fluctuation analysis at rat climbing fibre-Purkinje cell synapses
- PMID: 9660900
- PMCID: PMC2231069
- DOI: 10.1111/j.1469-7793.1998.881bj.x
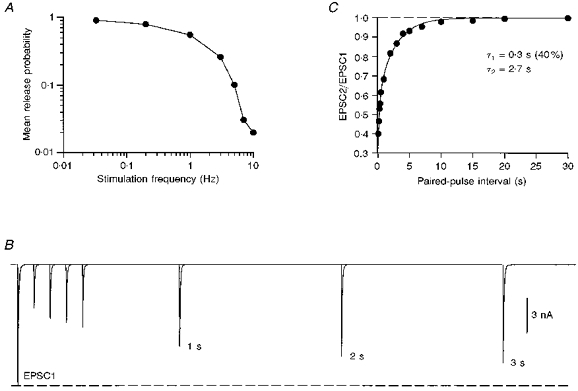
Locus of frequency-dependent depression identified with multiple-probability fluctuation analysis at rat climbing fibre-Purkinje cell synapses
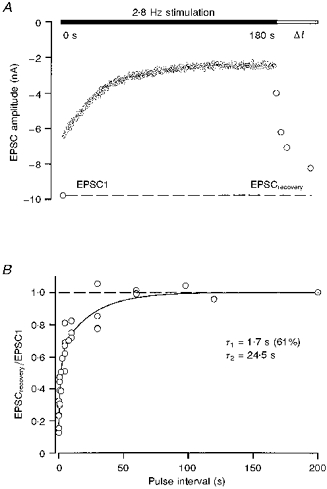
Abstract
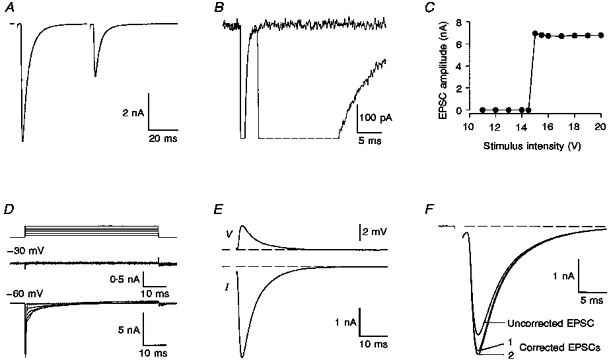
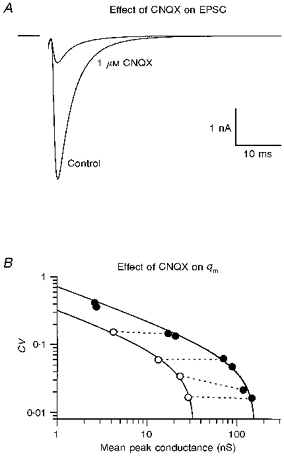
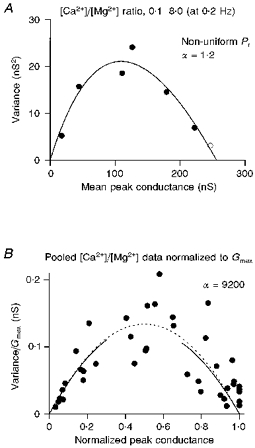
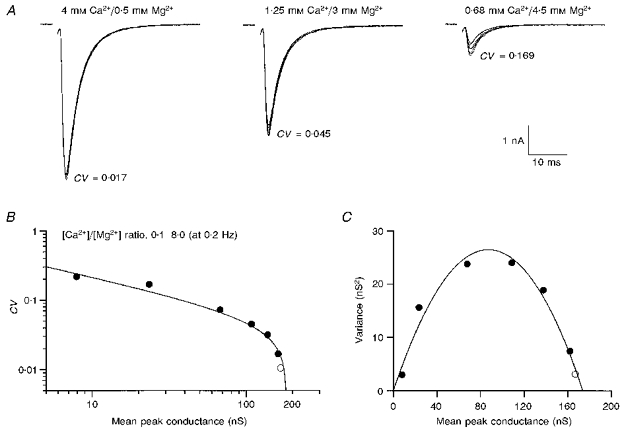
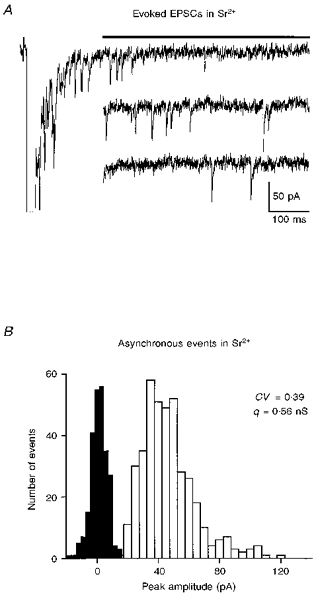
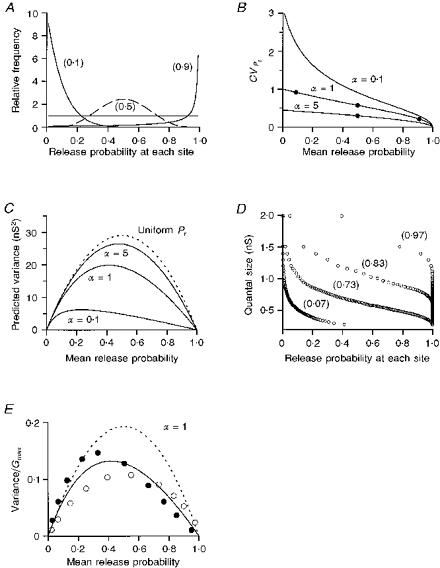
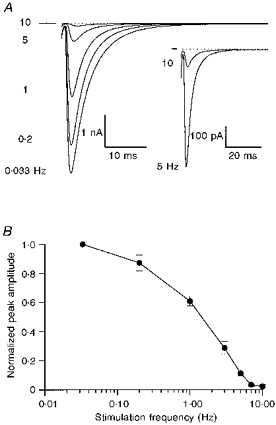
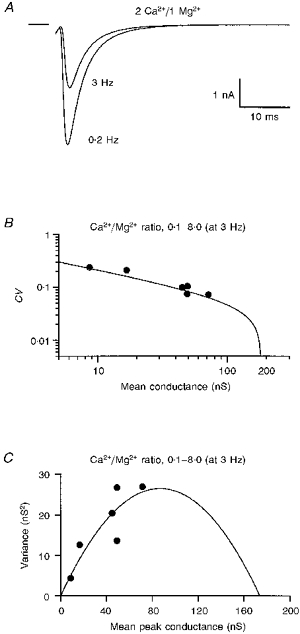
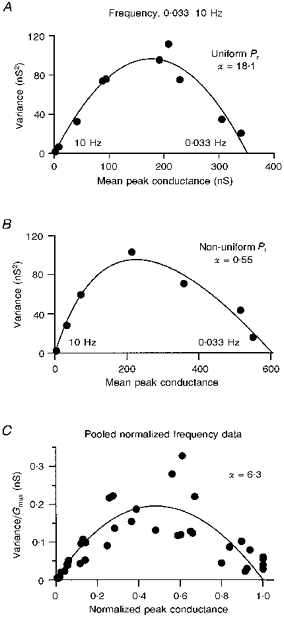
1. EPSCs were recorded under whole-cell voltage clamp at room temperature from Purkinje cells in slices of cerebellum from 12- to 14-day-old rats. EPSCs from individual climbing fibre (CF) inputs were identified on the basis of their large size, paired-pulse depression and all-or-none appearance in response to a graded stimulus. 2. Synaptic transmission was investigated over a wide range of experimentally imposed release probabilities by analysing fluctuations in the peak of the EPSC. Release probability was manipulated by altering the extracellular [Ca2+] and [Mg2+]. Quantal parameters were estimated from plots of coefficient of variation (CV) or variance against mean conductance by fitting a multinomial model that incorporated both spatial variation in quantal size and non-uniform release probability. This 'multiple-probability fluctuation' (MPF) analysis gave an estimate of 510 +/- 50 for the number of functional release sites (N) and a quantal size (q) of 0.5 +/- 0.03 nS (n = 6). 3. Control experiments, and simulations examining the effects of non-uniform release probability, indicate that MPF analysis provides a reliable estimate of quantal parameters. Direct measurement of quantal amplitudes in the presence of 5 mM Sr2+, which gave asynchronous release, yielded distributions with a mean quantal size of 0.55 +/- 0.01 nS and a CV of 0.37 +/- 0.01 (n = 4). Similar estimates of q were obtained in 2 mM Ca2+ when release probability was lowered with the calcium channel blocker Cd2+. The non-NMDA receptor antagonist 6-cyano-7-nitroquinoxaline-2,3-dione (CNQX; 1 microM) reduced both the evoked current and the quantal size (estimated with MPF analysis) to a similar degree, but did not affect the estimate of N. 4. We used MPF analysis to identify those quantal parameters that change during frequency-dependent depression at climbing fibre-Purkinje cell synaptic connections. At low stimulation frequencies, the mean release probability (pr) was unusually high (0.90 +/- 0.03 at 0.033 Hz, n = 5), but as the frequency of stimulation was increased, pr fell dramatically (0.02 +/- 0.01 at 10 Hz, n = 4) with no apparent change in either q or N. This indicates that the observed 50-fold depression in EPSC amplitude is presynaptic in origin. 5. Presynaptic frequency-dependent depression was investigated with double-pulse and multiple-pulse protocols. EPSC recovery, following simultaneous release at practically all sites, was slow, being well fitted by the sum of two exponential functions (time constants of 0.35 +/- 0.09 and 3.2 +/- 0.4 s, n = 5). EPSC recovery following sustained stimulation was even slower. We propose that presynaptic depression at CF synapses reflects a slow recovery of release probability following release of each quantum of transmitter. 6. The large number of functional release sites, relatively large quantal size, and unusual dynamics of transmitter release at the CF synapse appear specialized to ensure highly reliable olivocerebellar transmission at low frequencies but to limit transmission at higher frequencies.
Figures
Similar articles
-
Non-NMDA glutamate receptor occupancy and open probability at a rat cerebellar synapse with single and multiple release sites.J Physiol. 1996 Jul 1;494 ( Pt 1)(Pt 1):231-50. doi: 10.1113/jphysiol.1996.sp021487. J Physiol. 1996. PMID: 8814618 Free PMC article.
-
Presynaptic origin of paired-pulse depression at climbing fibre-Purkinje cell synapses in the rat cerebellum.J Physiol. 1998 Jan 15;506 ( Pt 2)(Pt 2):391-405. doi: 10.1111/j.1469-7793.1998.391bw.x. J Physiol. 1998. PMID: 9490867 Free PMC article.
-
Quantal components of unitary EPSCs at the mossy fibre synapse on CA3 pyramidal cells of rat hippocampus.J Physiol. 1993 Dec;472:615-63. doi: 10.1113/jphysiol.1993.sp019965. J Physiol. 1993. PMID: 7908327 Free PMC article.
-
Pharmacology of the metabotropic glutamate receptor mediated current at the climbing fiber to Purkinje cell synapse.Prog Brain Res. 2005;148:299-306. doi: 10.1016/S0079-6123(04)48023-6. Prog Brain Res. 2005. PMID: 15661198 Review.
-
Quantal analysis of excitatory postsynaptic currents at the hippocampal mossy fiber-CA3 pyramidal cell synapse.Adv Second Messenger Phosphoprotein Res. 1994;29:235-60. doi: 10.1016/s1040-7952(06)80019-4. Adv Second Messenger Phosphoprotein Res. 1994. PMID: 7848714 Review.
Cited by
-
Rab3 superprimes synaptic vesicles for release: implications for short-term synaptic plasticity.J Neurosci. 2006 Jan 25;26(4):1239-46. doi: 10.1523/JNEUROSCI.3553-05.2006. J Neurosci. 2006. PMID: 16436611 Free PMC article.
-
Target-dependent feedforward inhibition mediated by short-term synaptic plasticity in the cerebellum.J Neurosci. 2010 Jun 16;30(24):8171-9. doi: 10.1523/JNEUROSCI.0276-10.2010. J Neurosci. 2010. PMID: 20554867 Free PMC article.
-
Differential maturation of climbing fiber innervation in cerebellar vermis.J Neurosci. 2004 Apr 21;24(16):3926-32. doi: 10.1523/JNEUROSCI.5610-03.2004. J Neurosci. 2004. PMID: 15102908 Free PMC article.
-
Paired-pulse depression of unitary quantal amplitude at single hippocampal synapses.Proc Natl Acad Sci U S A. 2004 Jan 27;101(4):1063-8. doi: 10.1073/pnas.0307149101. Epub 2004 Jan 13. Proc Natl Acad Sci U S A. 2004. PMID: 14722357 Free PMC article.
-
Variance analysis as a method to predict the locus of plasticity at populations of non-uniform synapses.Front Cell Neurosci. 2023 Jul 17;17:1232541. doi: 10.3389/fncel.2023.1232541. eCollection 2023. Front Cell Neurosci. 2023. PMID: 37528963 Free PMC article.
References
-
- Altman J. Postnatal development of the cerebellar cortex in the rat. II. Phases in the maturation of Purkinje cells and of the molecular layer. Journal of Comparative Neurology. 1972;145:399–463. - PubMed
-
- Barbour B, Häusser M. Intersynaptic diffusion of neurotransmitter. Trends in Neurosciences. 1997;20:377–384. 10.1016/S0166-2236(96)20050-5. - DOI - PubMed
Publication types
MeSH terms
Substances
Grants and funding
LinkOut - more resources
Full Text Sources
Research Materials
Miscellaneous