. 1998 Aug 1;510 ( Pt 3)(Pt 3):941-62.
doi: 10.1111/j.1469-7793.1998.941bj.x.

A cross-bridge mechanism can explain the thixotropic short-range elastic component of relaxed frog skeletal muscle

Affiliations

A cross-bridge mechanism can explain the thixotropic short-range elastic component of relaxed frog skeletal muscle

K S Campbell et al. J Physiol. .

Abstract

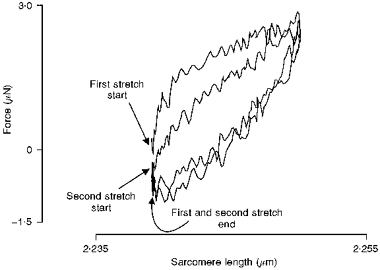
1. The passive tension and sarcomere length of relaxed frog skeletal muscle fibres were measured in response to imposed length stretches. The tension response to a constant-velocity stretch exhibited a clear discontinuity. Tension rose more rapidly during the initial approximately 0.4 % L0 of the stretch than during the latter stages (where L0 is the resting length of the fibre). This initial tension response is attributed to the short-range elastic component (SREC). 2. The use of paired triangular stretches revealed that the maximum tension produced during the SREC response of the second stretch was significantly reduced by the first stretch. This history-dependent behaviour of the SREC reflects thixotropic stiffness changes that have been previously described in relaxed muscle. 3. The biphasic nature of the SREC tension response to movement was most apparent during the first imposed length change after a period at a fixed length, irrespective of the direction of movement. 4. If a relaxed muscle was subjected to an imposed triangular length change so that the muscle was initially stretched and subsequently shortened back to its original fibre length, the resting tension at the end of the stretch was reduced relative to its initial pre-stretch value. Following the end of the stretch, tension slowly increased towards its initial value but the tension recovery was not accompanied by a contemporaneous increase in sarcomere length. This finding suggests that the resting tension of a relaxed muscle fibre is not entirely due to passive elasticity. The results are compatible with the suggestion that a portion of the resting tension - the filamentary resting tension (FRT) - is produced by a low level of active force generation. 5. If a second identical stretch was imposed on the muscle at a time when the resting tension was reduced by the previous stretch, the maximal tension produced during the second stretch was the same as that produced during the first, despite the second stretch commencing from a lower initial resting tension. 6. In experiments using paired triangular length changes, an inter-stretch interval of zero did not produce a substantially greater thixotropic reduction in the second stretch elastic limit force than an inter-stretch interval in the range 0.5-1 s. 7. A theoretical model was developed in which the SREC and FRT arise as manifestations of a small number of slowly cycling cross-bridges linking the actin and myosin filaments of a relaxed skeletal muscle. The predictions of the model are compatible with many of the experimental observations. If the SREC and FRT are indeed due to cross-bridge activity, the model suggests that the cross-bridge attachment rate must increase during interfilamentary movement. A mechanism (based on misregistration between the actin binding sites and the myosin cross-bridges) by which this might arise is presented.


Figures

Figure 1
Figure 1. Force and sarcomere length responses to two identical constant-velocity triangular stretches
Single relaxed semitendinosus muscle fibre. In all figures L0 is the fibre length which corresponds to a mean sarcomere length of 2.2 μm. Stretch length ∼ 0.01 L0. Stretch velocity ∼ 0.01 L0 s−1. Two stretches separated by 1.0 s. The fibre had been held at a constant length for 1 min before the first stretch was initiated. Tensions were measured from a baseline (arbitrarily assigned to be zero force) which corresponded to the mean resting tension in the 0.5 s period preceding the first stretch. Thus measured tension values could be less than, as well as greater than, the prevailing resting tension. Dashed lines show the tension baseline and the corresponding initial sarcomere length. The initial phase (SREC) proceeded until an elastic limit was reached. In the first stretch, this elastic limit occurred at a sarcomere length of 2.180 μm and a tension of 2.4 μN. The corresponding values in the second stretch were 2.180 μm and 1.2 μN. Temperature 5.0 °C.
Figure 2
Figure 2. SREC recovery following an initial stretch
Single semitendinosus muscle fibre. Individual trials were separated by a fixed period of 1 min and consisted of two identical triangular stretches of length ∼ 0.01 L0, velocity ∼ 0.01 L0 s−1 with a variable inter-stretch interval. Symbols show the mean elastic limit force ± standard deviation for the second stretch tension response at each inter-stretch interval. Dashed line shows the mean elastic limit force for the first stretch. This was independent of the inter-stretch interval. A minimum of three trials were performed at each inter-stretch interval. Temperature 5.5 °C. Four similar experiments were performed using single fibre preparations. With an inter-stretch interval of 0.5 s, the second stretch elastic limit force was 0.72 ± 0.09 (mean ± standard deviation, n = 4 preparations) of the corresponding first stretch value.
Figure 3
Figure 3. X-Y plot of force against sarcomere length for two constant-velocity triangular stretches
Single intact iliofibularis muscle fibre. Stretch length ∼ 0.011 L0. Stretch velocity ∼ 0.011 L0 s−1. Two stretches separated by 1.0 s. The fibre had been held at a constant length for 1 min before the first stretch was initiated. Temperature 6.0 °C.
Figure 4
Figure 4. Force and sarcomere length responses to three identical constant-velocity triangular stretches
Single intact iliofibularis muscle fibre. Stretch length ∼ 0.011 L0. Stretch velocity ∼ 0.011 L0 s−1. The fibre had been held at a constant length for 1 min before the first stretch was initiated. Temperature 5.0 °C.
Figure 5
Figure 5. Force and sarcomere length responses to triangular stretches of opposite polarity
Single relaxed iliofibularis muscle fibre. Thick lines show the tension and sarcomere length responses to a triangular stretch where lengthening preceded shortening. Thin lines show responses to a triangular stretch where shortening preceded lengthening. Stretch magnitude ∼ 0.01 L0. Stretch velocity ∼± 0.01 L0 s−1. The fibre had been held at a constant length for 1 min before each stretch was initiated. Dashed lines show the tension baseline (defined as in Fig. 1) and the corresponding initial sarcomere length. Temperature 7.0 °C.
Figure 6
Figure 6. Force and sarcomere length responses of the same fibre to two different velocity triangular stretches
Single iliofibularis muscle fibre. Stretch length ∼ 0.009 L0. Stretch velocities ∼ 0.009 and ∼ 0.09 L0 s−1. Note that the right-hand traces are drawn with a time base ten times faster than the left-hand traces. In both cases, the muscle fibre had been held at a constant length for 1 min before the stretch was initiated. Dashed lines show the tension baseline and the corresponding initial sarcomere length. Temperature 6.0 °C.
Figure 7
Figure 7. SREC stiffness for different stretch velocities
Intact iliofibularis muscle fibre. Triangular stretch length ∼ 0.009 L0. Trials were repeated at fixed intervals of 1 min. Stiffness expressed as Young's Modulus. Temperature 5.5 °C. The continuous line shows the best fit of a curvilinear relationship chosen to represent the trend of the experimental data. It is not the prediction of a theoretical model.
Figure 8
Figure 8. Elastic limit force for different stretch velocities
Single iliofibularis muscle fibre. Triangular stretch length ∼ 0.009 L0. Trials were repeated at fixed intervals of 1 min. Temperature 5.5 °C. As in Fig. 7 the continuous line represents the trend of the experimental data.
Figure 9
Figure 9. Elastic limit for different stretch velocities
Bundle of 5 intact iliofibularis muscle fibres. Triangular stretch length ∼ 0.015 L0. Trials were repeated at fixed intervals of 1 min. Temperature 5.0 °C. As in Fig. 7 the continuous line represents the trend of the experimental data.
Figure 10
Figure 10. Simulation of force, cross-bridge force, proportion of attached cross-bridges and sarcomere length responses to two identical constant-velocity triangular stretches
Stretch length 0.01 L0. Stretch velocity 0.01 L0 s−1. Two stretches separated by 1.0 s. Force simulations: thick line, overall muscle tension; thin line, internal cross-bridge force Fcb. The passive component of the tension response is represented by the difference between the overall muscle tension and the internal cross-bridge force. In the interests of clarity it has not been plotted in this diagram. As in the case of the experimental results, forces are measured as deviations from the prevailing resting tension at the beginning of the first stretch. Thus tension values can be less than as well as greater than zero. This diagram should be compared with the corresponding experimental results shown in Fig. 1. Dotted lines show the tension baseline, the initial sarcomere length and the proportion of cross-bridges attached at the commencement of the first stretch.
Figure 11
Figure 11. Simulation of the elastic limit force recovery following an initial stretch
Two identical stretches separated by a variable time delay. Stretch length 0.01 L0. Stretch velocity 0.01 L0 s−1. Symbols show the elastic limit force for the second stretch. Dashed line shows the elastic limit force for the first stretch. This was independent of the inter-stretch interval. This diagram should be compared with the corresponding experimental results shown in Fig. 2.
Figure 12
Figure 12. Simulation of the velocity dependence of the tension responses
A, SREC stiffness (Young's Modulus). B, elastic limit stress. C, elastic limit. Stretch length 0.02 L0. ▴, values simulated by the Cross-bridge Population Displacement Mechanism presented in the Appendix. ^, simulated values when a viscous component is added in parallel with the cross-bridge and parallel elastic components shown in Fig. 13. The viscosity produces a force F = ηv where η represents the viscous coefficient (1.82 × 10⁹ N m−3 s per half-sarcomere) and v is the interfilamentary sliding velocity in metres per second. The viscous component has a negligible effect on the simulated values for stretch velocities less than 0.02 L0 s−1.
Figure 13
Figure 13. Three-component model. A, parallel elastic and cross-bridge components in conjunction with a series elastic component. B, mathematical definitions
A, the series elastic component represents the tendon attachments. The parallel elastic component represents the effect of the sarcolemma, sarcoplasmic reticulum, titin filaments and other passive structures within the sarcomere. The parallel and series components are modelled as linear springs. The cross-bridge component is more complicated and simulates the cross-bridge interactions between actin and myosin filaments in a half-sarcomere. It acts both as a tension generator and a short-range elastic element. B, the model's state is defined by the parallel component length Xp, the parallel component stiffness kp, the series component length Xs, the series component stiffness ks and the cross-bridge force Fcb. The overall length X and tension F are defined in terms of these parameters. The parallel component length Xp corresponds to the mean half-sarcomere length of a real muscle.
Figure 15
Figure 15. Redistribution of the cross-bridge population during an imposed stretch
The six graphs show an illustrative example of the redistribution of the attached cross-bridges during an imposed stretch. Y-axes show the number of attached cross-bridges per nanometre as a fraction of the total cross-bridge number; X-axes show the corresponding cross-bridge displacements. The graphs illustrate the cross-bridge distribution at (from left to right, top to bottom) 0.0 s, 0.1 s, 0.2 s, 0.4 s, 0.6 s and 0.8 s, respectively, after the start of an imposed stretch. Stretch velocity 0.01 L0 s−1 (i.e. the filaments would be displaced at a relative velocity of 11 nm s−1 if the series elastic component was infinitely stiff). The cross-bridge population is redistributed from a symmetrical equilibrium profile around x0 at time t = 0, to a steady-state distribution maintained by the sustained stretch.
Figure 14
Figure 14. Movement enhancement mechanism
A, actin binding sites which are potentially available to interact with the myosin filament are separated by a mean distance y. Cross-bridges which can bind to an available actin site are separated by z. Each cross-bridge has an interaction range w. B, if the filaments are moved a relative distance ΔXp (in either direction) in unit time, the attachment rate constant is increased proportionally with the distance moved by each cross-bridge. Full details of the proposed ‘movement enhancement’ are found in the text.

Similar articles

Cited by

References

    1. Bagni MA, Cecchi G, Colomo F, Garzella P. Are weakly binding bridges present in resting intact muscle fibers? Biophysical Journal. 1992;63:1412–1415. - PMC - PubMed
    1. Bagni MA, Cecchi G, Colomo F, Garzella P. Absence of mechanical evidence for attached weakly binding cross-bridges in frog relaxed muscle fibres. The Journal of Physiology. 1995;482:391–400. - PMC - PubMed
    1. Bartoo ML, Linke WA, Pollack GH. Basis of passive tension and stiffness in isolated rabbit myofibrils. American Journal of Physiology. 1997;273:C266–276. - PubMed
    1. Bershitsky SY, Tsturyan AK, Bershitskaya ON, Mashanov GI, Brown P, Burns R, Ferenczi MA. Muscle force is generated by myosin heads stereospecifically attached to actin. Nature. 1997;388:186–190. 10.1038/40651. - DOI - PubMed
    1. Brenner B. Muscle mechanics and biochemical kinetics. In: Squire JM, editor. Molecular Mechanisms in Muscular Contraction. London: Macmillan Press; 1990. pp. 77–150.

Publication types

LinkOut - more resources