Clinical Trial
. 1998 Aug 1;510 ( Pt 3)(Pt 3):977-85.
doi: 10.1111/j.1469-7793.1998.977bj.x.

Changes in Achilles tendon moment arm from rest to maximum isometric plantarflexion: in vivo observations in man

Affiliations
Clinical Trial

Changes in Achilles tendon moment arm from rest to maximum isometric plantarflexion: in vivo observations in man

C N Maganaris et al. J Physiol. .

Abstract

1. The purpose of the present study was to examine the effect of a plantarflexor maximum voluntary contraction (MVC) on Achilles tendon moment arm length. 2. Sagittal magnetic resonance (MR) images of the right ankle were taken in six subjects both at rest and during a plantarflexor MVC in the supine position at a knee angle of 90 deg and at ankle angles of -30 deg (dorsiflexed direction), -15 deg, 0 deg (neutral ankle position), +15 deg (plantarflexed direction), +30 deg and +45 deg. A system of mechanical stops, support triangles and velcro straps was used to secure the subject in the above positions. Location of a moving centre of rotation was calculated for ankle rotations from -30 to 0 deg, -15 to +15 deg, 0 to +30 deg and +15 to +45 deg. All instant centres of rotation were calculated both at rest and during MVC. Achilles tendon moment arms were measured at ankle angles of -15, 0, +15 and +30 deg. 3. At any given ankle angle, Achilles tendon moment arm length during MVC increased by 1-1.5 cm (22-27 %, P < 0.01) compared with rest. This was attributed to a displacement of both Achilles tendon by 0.6-1.1 cm (P < 0.01) and all instant centres of rotation by about 0.3 cm (P < 0.05) away from their corresponding resting positions. 4. The findings of this study have important implications for estimating loads in the musculoskeletal system. Substantially unrealistic Achilles tendon forces and moments generated around the ankle joint during a plantarflexor MVC would be calculated using resting Achilles tendon moment arm measurements.


Figures
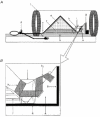
Figure 1
Figure 1. Diagram of the experimental set-up
A shows foot triangle block for positioning the ankle joint (a). The example shown is for an ankle angle of -15 deg where the oblique plane of the triangle on which the foot was placed formed an angle of 60 deg with the horizontal level. Horizontal board (b) for fixing mechanical stops (d) and (g). Velcro strap (c) at the level of hip joint and mechanical stops (d) for the upper body, knee isosceles triangle support (e) for positioning the lower leg at an angle of 45 deg relative to the horizontal level, boards (f) for adjusting the height of the knee triangle support (e), mechanical stop (g) for the tested foot, velcro strap (h) for fixating the heel (1) and the foot (2) on the foot block, anterior-neck surface coil (i) and MRI scanner (j). B, enlarged diagram of ankle and foot, with a, b, f, g and i as in A. Exact positioning of velcro straps for fixation of heel (h1) and foot (h2) are shown.
Figure 2
Figure 2. Sagittal MR images of the ankle joint
Sagittal MR images of the ankle joint at rest (A) and during an MVC with the ankle plantarflexors (B) at an ankle angle of +30 deg in one of the tested subjects. C1 and C2 are the instant centres of rotation calculated for an ankle rotation from +15 to +45 deg at rest (A) and during MVC (B), respectively. In each image the Achilles tendon is the black line next to the Kager's triangle (white triangular area). The straight white line drawn through the middle of the Achilles tendon represents the Achilles tendon action line. Points A1 and B1 in the image at rest and points A2 and B2 in the image during MVC are the markers whose horizontal position was measured in relation to a common reference point for assessing a displacement of the Achilles tendon in the transition from rest to MVC. Black lines a and b represent Achilles tendon moment arms at rest and during MVC, respectively. A displacement of the Achilles tendon in the transition from rest to MVC is indicated by an increase in the area that the Kager's triangle occupies during MVC compared with rest. The shift in the position of the instant centre of rotation in the transition from rest to MVC is also illustrated.
Figure 3
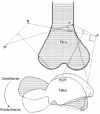
Figure 3. Representation of the graphical method (Reuleaux, 1875) used in the study for calculating instant centres of rotation
Talus represents the whole rotating segment in relation to which two reference points were marked. The intersection of the perpendicular bisectors to the lines connecting points A and A′ and points B and B′ was the instant centre of rotation for that given ankle rotation.
Figure 4
Figure 4. Changes in the Achilles tendon moment arm as a function of ankle angle at rest and during a plantarflexor MVC
Values are means ±s.d. (n = 6). ** Significant difference (P < 0.01) between rest and MVC at any given ankle angle.
Figure 5
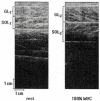
Figure 5. Sagittal sonographs of gastrocnemius lateralis and soleus muscles
Sagittal ultrasound images of gastrocnemius lateralis and soleus muscles at rest (GL1 and Sol1, respectively) and during a plantarflexor MVC (GL2 and Sol2, respectively). Presented sonographs were taken in the subject whose sagittal MRI scans at rest and during a plantarflexor MVC are presented in Fig. 4. Position of the subject is identical during ultrasound and MRI scanning (ankle and knee angles at +30 deg and 90 deg, respectively. The white horizontal stripes are echoes derived from the superficial and deep aponeuroses of each muscle and the oblique stripes are echoes derived from the fascia septas between the muscle fascicles. Notice the difference in muscle thickness (distance between superficial and deep aponeuroses) between rest and MVC in the scanned muscles.
Figure 6
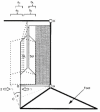
Figure 6. Biomechanical model of the lower extremity
Two-dimensional model of the lower extremity (lateral aspect of the right foot) at the reference ankle position representing the foot as a rigid body neglecting intertarsal, tarsometatarsal, metatarsophalangeal and interphalangeal joints. Continuous lines represent the positions of muscles at rest and dotted lines represent the positions of muscles during a plantarflexor MVC. K, knee joint; A, ankle joint; GL, gastrocnemius lateralis muscle; Sol, soleus muscle; a1 and b1, muscle thickness in gastrocnemius lateralis and soleus at rest respectively; a2 and b2, muscle thickness in gastrocnemius lateralis and soleus during a plantarflexor MVC, respectively; 1 and 2, orientations of Achilles tendon at rest and during a plantarflexor MVC, respectively; e, angle between orientations of Achilles tendon at rest and during a plantarflexor MVC; (A-B) and (A-C), Achilles tendon moment arm lengths at rest and during a plantarflexor MVC, respectively. According to the present model, tissue behind the deep aponeurosis of soleus (grey area) does not deform in the transition from rest to MVC, as a result of an increase in the thickness in gastrocnemius lateralis and soleus. Such an assumption is based on an increased intramuscular pressure in adjoining co-contracting muscles (synergists, stabilizers or antagonists) during an agonists MVC in a segment where bones do not deform in response to changes in muscle shape.

Similar articles

Cited by

References

    1. An KN, Hui FC, Morrey BF, Linscheid RL, Chao EY. Muscles across the elbow joint: a biomechanical analysis. Journal of Biomechanics. 1981;14:659–669. 10.1016/0021-9290(81)90048-8. - DOI - PubMed
    1. Burdett RG. Forces predicted at the ankle during running. Medicine and Science in Sports and Exercise. 1982;14:308–316. - PubMed
    1. Cummins EJ, Anson BJ, Carr BW, Wright RR, Hauser EDW. The structure of calcaneal tendon in relation to orthopedic surgery. Surgery, Gynecology and Obstetrics. 1946;83:107–116. - PubMed
    1. Fukunaga T, Roy RR, Shellock FG, Hodson JA, Edgerton VR. Specific tension of human plantarflexors and dorsiflexors. Journal of Applied Physiology. 1996;80:158–165. - PubMed
    1. Kawakami Y, Nakazawa K, Fujimoto T, Nozaki D, Miyashita M, Fukunaga T. Specific tension of elbow flexor and extensor muscles based on magnetic resonance imaging. European Journal of Applied Physiology. 1994;68:139–147. - PubMed

Publication types

LinkOut - more resources