. 1998 Jul;117(3):1037-45.
doi: 10.1104/pp.117.3.1037.

Does leaf position within a canopy affect acclimation of photosynthesis to elevated CO2?. Analysis Of a wheat crop under free-air co2 enrichment

Does leaf position within a canopy affect acclimation of photosynthesis to elevated CO2?. Analysis Of a wheat crop under free-air co2 enrichment

CP Osborne et al. Plant Physiol. 1998 Jul.

Abstract

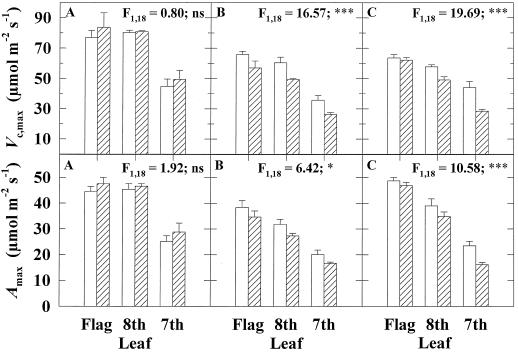
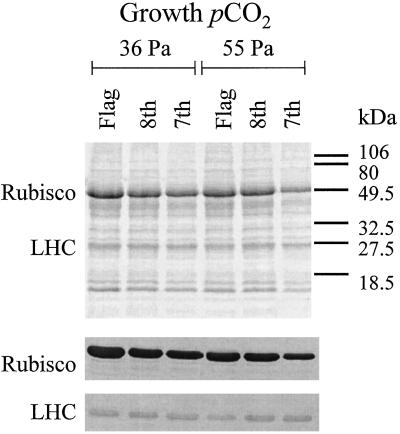
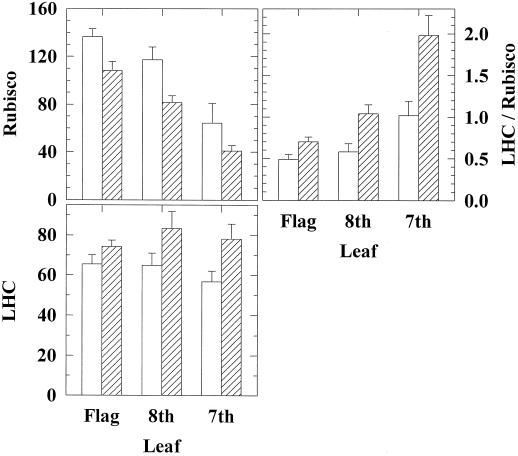
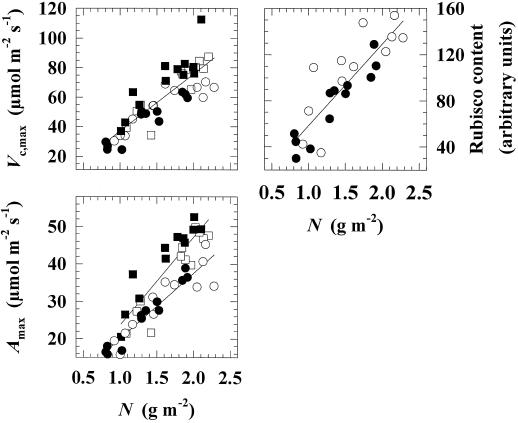
Previous studies of photosynthetic acclimation to elevated CO2 have focused on the most recently expanded, sunlit leaves in the canopy. We examined acclimation in a vertical profile of leaves through a canopy of wheat (Triticum aestivum L.). The crop was grown at an elevated CO2 partial pressure of 55 Pa within a replicated field experiment using free-air CO2 enrichment. Gas exchange was used to estimate in vivo carboxylation capacity and the maximum rate of ribulose-1,5-bisphosphate-limited photosynthesis. Net photosynthetic CO2 uptake was measured for leaves in situ within the canopy. Leaf contents of ribulose-1,5-bisphosphate carboxylase/oxygenase (Rubisco), light-harvesting-complex (LHC) proteins, and total N were determined. Elevated CO2 did not affect carboxylation capacity in the most recently expanded leaves but led to a decrease in lower, shaded leaves during grain development. Despite this acclimation, in situ photosynthetic CO2 uptake remained higher under elevated CO2. Acclimation at elevated CO2 was accompanied by decreases in both Rubisco and total leaf N contents and an increase in LHC content. Elevated CO2 led to a larger increase in LHC/Rubisco in lower canopy leaves than in the uppermost leaf. Acclimation of leaf photosynthesis to elevated CO2 therefore depended on both vertical position within the canopy and the developmental stage.


Figures

Figure 1
Figure 1
Vc, max and Amax for the flag, 8th, and 7th leaves in wheat grown in elevated pCO2 (hatched bars) and control conditions (white bars). Means (±1 sd) are indicated for the four replicate plots of elevated pCO2 and control during three stages of crop development: A, Inflorescence emergence (1994); B, early grain development (1994); and C, mid-grain development (1993). F values and their significance level for the effect of elevated pCO2 are given. ns, Not statistically significant at the P = 0.05 level; *, statistically significant at the P = 0.05 level; ***, statistically significant at the P = 0.001 level. There was always a significant effect of leaf position on both measures (F2, 18 > 25; P = 0.001) and a significant interaction of elevated pCO2 and leaf position for Vc, max at mid-grain development (F2, 18 = 4.46; P = 0.05).
Figure 2
Figure 2
Rubisco and LHC proteins during early grain development for the flag, 8th, and 7th leaves in wheat grown in elevated pCO2 and control conditions. Top, Coomassie blue-stained gel. Loaded extracts were obtained from equal leaf areas. The most intensively stained bands are the large-subunit polypeptide of Rubisco at 56 kD and LHC at 27.5 kD. Bottom, Western blot showing the reaction with the large-subunit polypeptide of Rubisco and LHC.
Figure 3
Figure 3
Rubisco, LHC, and LHC/Rubisco for the flag, 8th, and 7th leaves in wheat grown in elevated pCO2 (hatched bars) and control conditions (white bars). Values are the protein content determined on a leaf-area basis and expressed in arbitrary units of absorbance to a common scale. Means (±1 sd) are indicated for the four replicate plots of elevated pCO2 and control during early grain development (1994). Two-way ANOVA showed that leaf position in the canopy had a highly significant effect on Rubisco (F2, 18 = 27.51; P = 0.001) and LHC/Rubisco (F2, 18 = 23.19; P = 0.001) but had no effect on LHC (F2, 18 = 0.59; not significant). Elevated pCO2 had a highly significant effect on Rubisco (F1, 18 = 13.80; P = 0.01), LHC (F1, 18 = 10.51; P = 0.01), and LHC/Rubisco (F1, 18 = 22.81; P = 0.001). There was a statistically significant interaction between leaf position in the canopy and elevated pCO2 for LHC/Rubisco (F2, 18 = 3.75; P = 0.05).
Figure 4
Figure 4
Scatter plots of Vc, max and Amax and Rubisco content against N. There was always a highly significant regression relationship (P = 0.01) between Vc, max, Amax, or Rubisco with N when leaf positions were pooled within pCO2 treatment and crop developmental stage. One-way ANOVA was used to investigate changes in the slope of the regression attributable to growth pCO2 and the stage of crop development. ANOVA showed no change in the slope of regressions between Vc, max and N (F3, 42 = 2.44; not significant at P = 0.05) or Rubisco and N (F1, 22 = 0.11; not significant at P = 0.05). CO2 treatments were therefore pooled for the plotted regression lines. Elevated pCO2 had no effect on the slope of regressions between Amax and N, but a decrease in slope occurred during grain development compared with inflorescence emergence (F3, 42 = 3.43; P = 0.05). CO2 treatments were therefore pooled, but crop developmental stages were separated for regression lines. □, Inflorescence emergence at 36 Pa; ▪, inflorescence emergence at 55 Pa; ○, grain development at 36 Pa; •, grain development at 55 Pa.
Figure 5
Figure 5
Left, Diurnal course of A measured for the flag (▵), 8th (□), and 7th (○) leaves of wheat in control (36 Pa) conditions in the field. Middle, Diurnal course of A measured for the flag (▴), 8th (▪), and 7th (•) leaves of wheat in elevated pCO2 (55 Pa) conditions in the field. Measurements were made on DAE 101, at mid-grain development (1993). Each point is the mean (±1 sd) for six measurements made within a 90-min period in two replicate blocks. MST, U.S. Mountain Standard Time. Right, Meteorological data for the daylight period of DAE 101 (1993) based on hourly average readings from the Arizona Meteorological Network station at Maricopa. Photosynthetically active photon flux density (Q), air temperature (Tair), and vapor pressure deficit (D) show patterns typical of the spring climate in the region (Kimball et al., 1995).

References

    1. Anderson JM. Photoregulation of the composition, function, and structure of thylakoid membranes. Annu Rev Plant Physiol. 1986;37:93–136.
    1. Baker NR, McKiernan M. Modifications to the photosynthetic apparatus of higher plants in response to changes in the light environment. Biol J Linn Soc. 1988;34:193–203.
    1. Björkman O. Responses to different quantum flux densities. In: Lange OL, Nobel PS, Osmond CB, Ziegler H, editors. Encyclopedia of Plant Physiology: Physiological Plant Ecology I (New Series), Vol 12A. Berlin: Springer-Verlag; 1981. pp. 57–107.
    1. Coleman JS, McConnaughay KDM, Bazzaz FA. Elevated CO2 and plant nitrogen-use: is reduced tissue nitrogen concentration size-dependent? Oecologia. 1993;93:195–200. - PubMed
    1. Dalling MJ, Boland G, Wilson JH. Relationship between acid protease activity and redistribution of nitrogen during grain development in wheat. Aust J Plant Physiol. 1976;3:721–730.

LinkOut - more resources