T cells and T-cell cytokine transcripts in the synovial membrane in patients with osteoarthritis
- PMID: 9665944
- PMCID: PMC95595
- DOI: 10.1128/CDLI.5.4.430-437.1998
T cells and T-cell cytokine transcripts in the synovial membrane in patients with osteoarthritis
Abstract
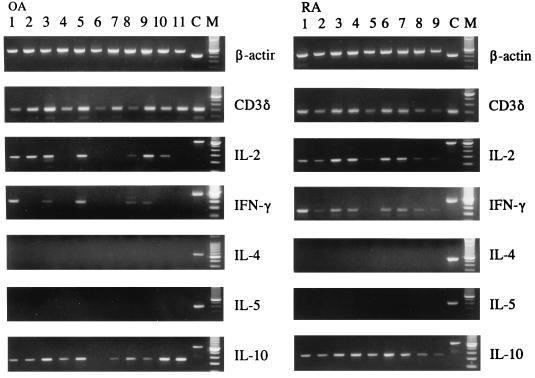
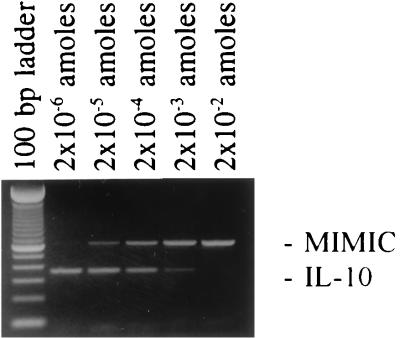
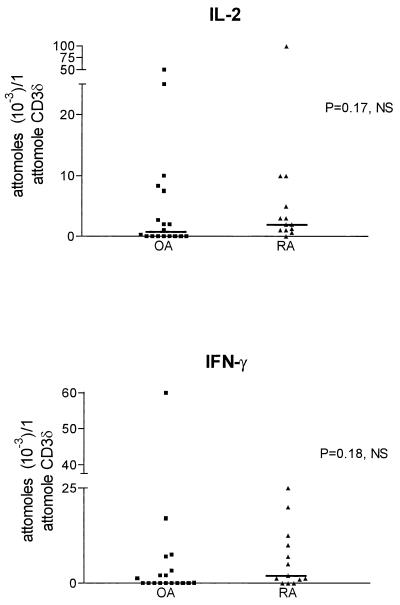
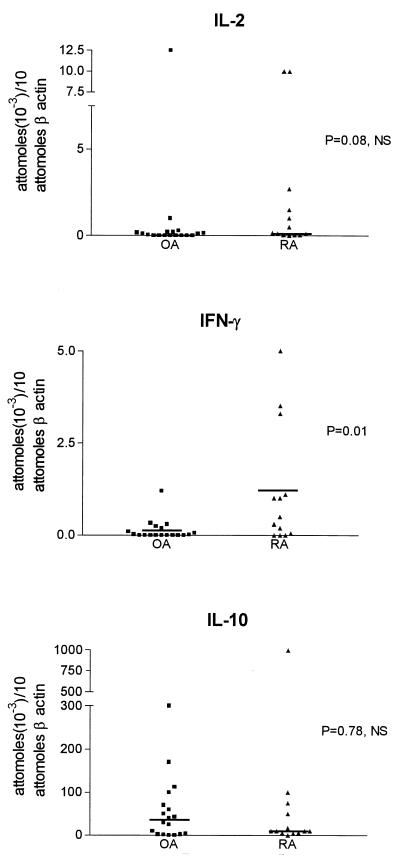
The synovial membrane in osteoarthritis (OA) often exhibits inflammatory infiltrates, but the role of T cells in these infiltrates is not known. T-cell activation antigens were analyzed by immunohistochemistry, and T-cell cytokine transcripts were measured by competitive PCR in synovial membranes from patients with OA and rheumatoid arthritis (RA). Lymphoid cell aggregates, containing primarily CD3+ T lymphocytes, were found in 65% of patients with OA. Mononuclear cells expressing the activation antigens CD69, CD25, CD38, CD43, CD45RO, and HLA class II were present in both patient groups, although in higher numbers in patients with RA. Interleukin 2 (IL-2) transcripts were found in 10 of 18 patients with OA versus 12 of 13 patients with RA (P = 0.03). Gamma interferon (IFN-gamma) transcripts were detected in 9 of 18 patients with OA versus 10 of 13 patients with RA (not significant), whereas IL-10 transcripts were found in nearly all patients. IL-4 and IL-5 were not detected in any patients. The levels of IFN-gamma and IL-2 transcripts, normalized for T-cell number equivalents, were not statistically different between OA and RA, but the levels of IFN-gamma, normalized for total cell number equivalents, were lower in OA than in RA (P = 0.01). Synovial membranes that expressed IL-2 and IFN-gamma transcripts were more likely to have heavier infiltrations of T cells and cells bearing activation markers than synovial membranes that did not express these cytokines. The presence of activated T cells and TH1 cytokine transcripts in chronic joint lesions of patients with OA suggests that T cells contribute to chronic inflammation in a large proportion of these patients.
Figures


Comment in
-
Cellular immunity in osteoarthritis: novel concepts for an old disease.Clin Diagn Lab Immunol. 1998 Jul;5(4):427-9. doi: 10.1128/CDLI.5.4.427-429.1998. Clin Diagn Lab Immunol. 1998. PMID: 9665943 Free PMC article. Review. No abstract available.
References
-
- Akbar A N, Terry L, Timms A, Beverley P C, Janossy G. Loss of CD45R and gain of UCHL1 reactivity is a feature of primed T cells. J Immunol. 1988;140:2171–2178. - PubMed
-
- Alsalameh S, Mollenhauter J, Hain N, Stock K-P, Kalden J, Burmester G R. Cellular immune response toward human articular chondrocytes. T cell reactivities against chondrocyte and fibroblast membranes in destructive joint diseases. Arthritis Rheum. 1990;33:1477–1486. - PubMed
-
- Altman D G. Practical statistics for medical research. London, England: Chapman & Hall; 1991.
-
- Arnett F C, Edworthy S M, Bloch D A, McShane D J, Fries J F, Cooper N S, Healey L A, Kaplan S R, Liang M H, Luthra H S, Medger T A, Jr, Mitchell D M, Neustadt D H, Pinals R S, Schaller J G, Sharp J T, Wilder R L, Hunder G G. The American Rheumatism Association 1987 criteria for the classification of rheumatoid arthritis. Arthritis Rheum. 1988;31:315–324. - PubMed
-
- Bucht A, Larsson P, Weisbrot L, Thorne C, Pisa P, Smedegaard G, Keystone E C, Gronberg A. Expression of interferon-gamma (IFN-γ), IL-10, IL-12 and transforming growth factor-beta (TGF-beta) mRNA in synovial fluid cells from patients in the early and late phases of rheumatoid arthritis. Clin Exp Immunol. 1996;103:357–367. - PMC - PubMed
Publication types
MeSH terms
Substances
Grants and funding
LinkOut - more resources
Full Text Sources
Other Literature Sources
Medical
Research Materials