Effect of ovalbumin aerosol exposure on colonization of the porcine upper airway by Pasteurella multocida and effect of colonization on subsequent immune function
- PMID: 9665955
- PMCID: PMC95606
- DOI: 10.1128/CDLI.5.4.494-498.1998
Effect of ovalbumin aerosol exposure on colonization of the porcine upper airway by Pasteurella multocida and effect of colonization on subsequent immune function
Abstract
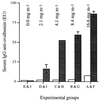
Seventy-three piglets were weaned at 1 week of age, randomly assigned to 10 groups (A to J), accommodated in stainless steel exposure chambers, and exposed continuously to a controlled environment containing aerosolized ovalbumin. The concentrations of ovalbumin dust were as follows (milligrams per cubic meter): A and F, 16.6; B and G, 8.4; C and H, 4.2; D and I, 2.1; E and J, 0. At weekly intervals, the pigs were bled via venipuncture and anesthetized for nasal lavage and tonsilar biopsies performed for subsequent bacteriologic analysis. At 2 weeks of age, the pigs in groups A to E were challenged with toxigenic Pasteurella multocida (10(8) CFU pig(-1)), and at 6 weeks of age, the pigs were euthanatized. At postmortem, the extent of turbinate atrophy was assessed on the snout sections by using a morphometric index. Exposure to aerial ovalbumin resulted in a dose-dependent increase in serum antiovalbumin immunoglobulin G (IgG; P < 0.001) and serum antiovalbumin IgA (P < 0.001). Exposure also caused a significant increase in the numbers of P. multocida organisms isolated from the upper respiratory tract (P < 0.001) and a corresponding increase in turbinate atrophy, as judged by the morphometric index (P < 0.001). Concurrent challenge with P. multocida and ovalbumin resulted in a significant decrease in both the IgG and IgA responses to ovalbumin (P < 0.001). These results show that ovalbumin exposure increases pig susceptibility to P. multocida colonization and that toxigenic P. multocida modifies the serum IgG and IgA responses to ovalbumin in the pig. Both of these effects may enhance the virulence of this respiratory pathogen and so influence the pathogenesis of atrophic rhinitis in pigs.
Figures


Similar articles
-
Contributory and exacerbating roles of gaseous ammonia and organic dust in the etiology of atrophic rhinitis.Clin Diagn Lab Immunol. 1999 Mar;6(2):199-203. doi: 10.1128/CDLI.6.2.199-203.1999. Clin Diagn Lab Immunol. 1999. PMID: 10066654 Free PMC article.
-
Effects of ammonia inhalation and acetic acid pretreatment on colonization kinetics of toxigenic Pasteurella multocida within upper respiratory tracts of swine.J Clin Microbiol. 1998 May;36(5):1260-5. doi: 10.1128/JCM.36.5.1260-1265.1998. J Clin Microbiol. 1998. PMID: 9574688 Free PMC article.
-
Modulation of the humoral immune response of swine and mice mediated by toxigenic Pasteurella multocida.FEMS Immunol Med Microbiol. 2003 Oct 24;39(1):51-9. doi: 10.1016/S0928-8244(03)00201-3. FEMS Immunol Med Microbiol. 2003. PMID: 14556996
-
Molecular aspects of the virulence of Pasteurella multocida.Can J Vet Res. 1990 Apr;54 Suppl:S45-7. Can J Vet Res. 1990. PMID: 2193704 Review.
-
[Atrophic rhinitis A.D. 1991].Tijdschr Diergeneeskd. 1991 Dec 15;116(24):1221-30. Tijdschr Diergeneeskd. 1991. PMID: 1750030 Review. Dutch.
Cited by
-
Pasteurella multocida toxin prevents osteoblast differentiation by transactivation of the MAP-kinase cascade via the Gα(q/11)--p63RhoGEF--RhoA axis.PLoS Pathog. 2013;9(5):e1003385. doi: 10.1371/journal.ppat.1003385. Epub 2013 May 16. PLoS Pathog. 2013. PMID: 23696743 Free PMC article.
-
Pasteurella multocida toxin interaction with host cells: entry and cellular effects.Curr Top Microbiol Immunol. 2012;361:93-111. doi: 10.1007/82_2012_219. Curr Top Microbiol Immunol. 2012. PMID: 22552700 Free PMC article. Review.
-
Cellular and molecular action of the mitogenic protein-deamidating toxin from Pasteurella multocida.FEBS J. 2011 Dec;278(23):4616-32. doi: 10.1111/j.1742-4658.2011.08158.x. Epub 2011 May 31. FEBS J. 2011. PMID: 21569202 Free PMC article. Review.
-
The porcine lung as a potential model for cystic fibrosis.Am J Physiol Lung Cell Mol Physiol. 2008 Aug;295(2):L240-63. doi: 10.1152/ajplung.90203.2008. Epub 2008 May 16. Am J Physiol Lung Cell Mol Physiol. 2008. PMID: 18487356 Free PMC article. Review.
References
-
- Alivisators G P, Marketos N, Vava Z. Die Immunitätsparalyse bei Brucellosen. Z Immunitaetsforsch Exp Ther. 1962;122:291–297.
-
- Baekbo P. Proceedings of the 11th Congress of the International Pig Veterinary Society. 1990. Air quality in Danish pig herds; pp. 395–397.
-
- Bloomfield A L, Mateer J G. Changes in skin sensitiveness of tuberculin during epidemic influenza. Am Rev Tuberculosis. 1919;3:166–170.
-
- Caraffa C. Contributo clinico allo studio dell’allergia turberculclinca nelle diverse fasi della pertose. Clin Pediatr. 1932;14:935–940.
-
- Cermack J P, Ross P A. Airborne dust associated with animal housing tasks. Farm Building Progress. 1978;51:11–15.
Publication types
MeSH terms
Substances
LinkOut - more resources
Full Text Sources
Miscellaneous

