

Effect of excessive weight gain with intensive therapy of type 1 diabetes on lipid levels and blood pressure: results from the DCCT. Diabetes Control and Complications Trial
- PMID: 9669786
- PMCID: PMC2622729
- DOI: 10.1001/jama.280.2.140
Effect of excessive weight gain with intensive therapy of type 1 diabetes on lipid levels and blood pressure: results from the DCCT. Diabetes Control and Complications Trial
Erratum in
- JAMA 1998 Nov 4;280(17):1484
Abstract
Context: Intensive treatment of type 1 diabetes results in greater weight gain than conventional treatment.
Objective: To determine the effect of this weight gain on lipid levels and blood pressure.
Design: Randomized controlled trial; ancillary study of the Diabetes Control and Complications Trial (DCCT).
Setting: Twenty-one clinical centers.
Participants: The 1168 subjects enrolled in DCCT with type 1 diabetes who were aged 18 years or older at baseline.
Intervention: Randomized to receive either intensive (n = 586) or conventional (n = 582) diabetes treatment with a mean follow-up of 6.1 years.
Main outcome measures: Plasma lipid levels and blood pressure in each treatment group categorized by quartile of weight gain.
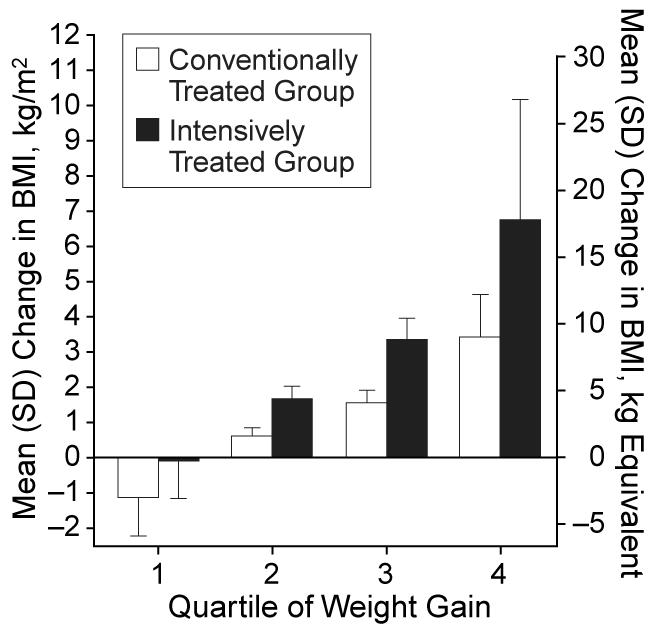
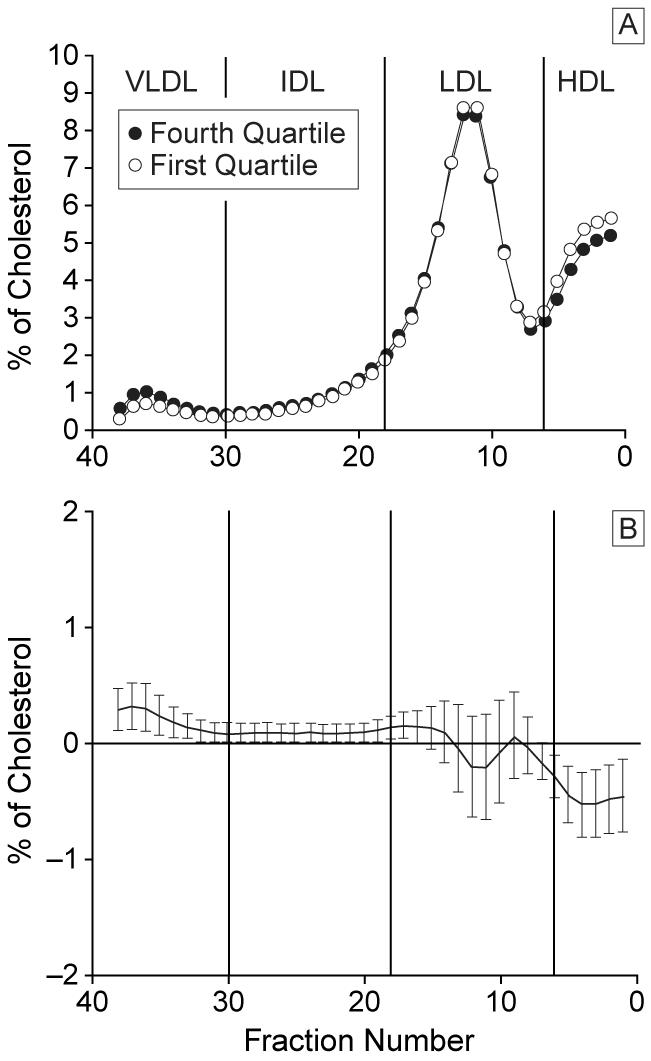
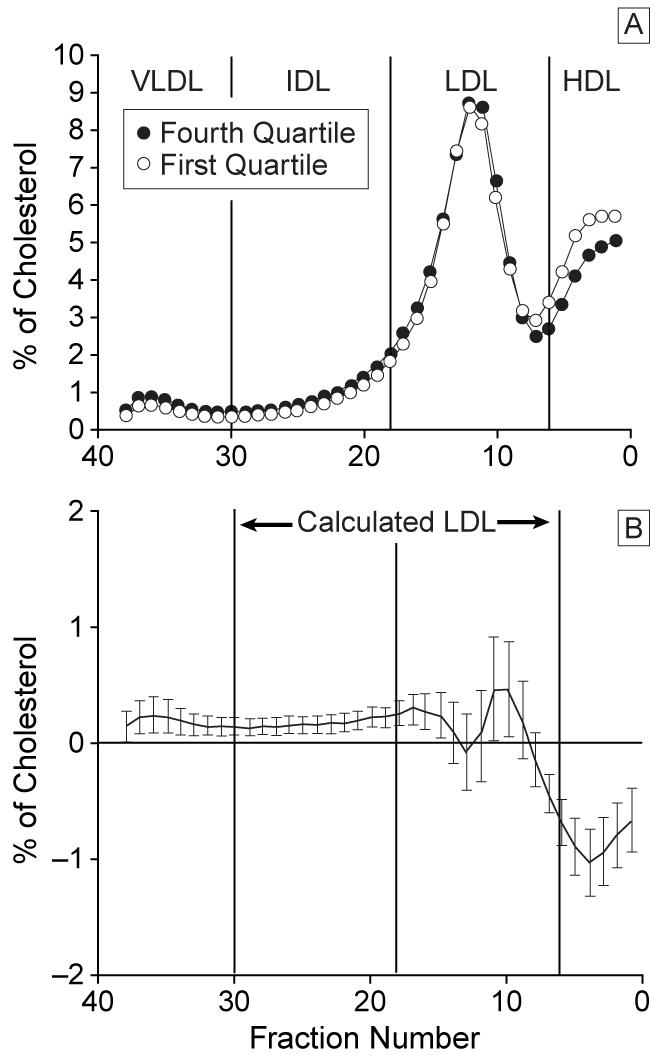
Results: With intensive treatment, subjects in the fourth quartile of weight gain had the highest body mass index (BMI) (a measure of weight adjusted for height), blood pressure, and levels of triglyceride, total cholesterol, low-density lipoprotein cholesterol (LDL-C), and apolipoprotein B compared with the other weight gain quartiles with the greatest difference seen when compared with the first quartile (mean values for the highest and lowest quartiles: BMI, 31 vs 24 kg/m2; blood pressure, 120/77 mm Hg vs 113/73 mm Hg; triglyceride, 0.99 mmol/L vs 0.79 mmol/L [88 mg/dL vs 70 mg/dL]; LDL-C, 3.15 mmol/L vs 2.74 mmol/L [122 mg/dL vs 106 mg/dL]; and apolipoprotein B, 0.89 g/L vs 0.78 g/L; all P<.001). In addition, the fourth quartile group had a higher waist-to-hip ratio; more cholesterol in the very low density lipoprotein, intermediate dense lipoprotein, and dense LDL fractions; and lower high-density lipoprotein cholesterol and apolipoprotein A-I levels compared with the first quartile. Baseline characteristics were not different between the first and fourth quartiles of weight gain with intensive therapy except for a higher hemoglobin A1c in the fourth quartile. Weight gain with conventional therapy resulted in smaller increases in BMI, lipids, and systolic blood pressure.
Conclusions: The changes in lipid levels and blood pressure that occur with excessive weight gain with intensive therapy are similar to those seen in the insulin resistance syndrome and may increase the risk of coronary artery disease in this subset of subjects with time.
Figures
Comment in
-
Excessive weight gain and effects on lipids with intensive therapy of type 1 diabetes.JAMA. 1998 Dec 16;280(23):1991; author reply 1991-2. JAMA. 1998. PMID: 9863843 No abstract available.
-
Excessive weight gain and effects on lipids with intensive therapy of type 1 diabetes.JAMA. 1998 Dec 16;280(23):1991-2. JAMA. 1998. PMID: 9863844 No abstract available.
References
-
- Brunzell JD. Obesity and risk for cardiovascular disease. In: Greenwood MRC, editor. Contemporary Issues in Clinical Nutrition, Obesity. Churchill Livingston Inc; New York, NY: 1983. pp. 3–16.
-
- Laakso M, Pyorala K. Adverse effects of obesity on lipid and lipoprotein levels in insulin-dependent and non–insulin-dependent diabetes. Metabolism. 1990;39:117–122. - PubMed
-
- The Diabetes Control and Complications Trial Research Group Weight gain associated with intensive therapy in the Diabetes Control and Complications Trial. Diabetes Care. 1988;11:567–573. - PubMed
-
- Wing RR, Klein R, Moss SE. Weight gain associated with improved glycemic control in population-based sample of subjects with type I diabetes. Diabetes Care. 1990;13:1106–1109. - PubMed
-
- The Diabetes Control and Complications Trial Research Group Adverse events and their association with treatment regimens in the Diabetes Control and Complications Trial. Diabetes Care. 1995;18:1415–1427. - PubMed
