. 1998 Aug;18(8):4629-38.
doi: 10.1128/MCB.18.8.4629.

Disruption of higher-order folding by core histone acetylation dramatically enhances transcription of nucleosomal arrays by RNA polymerase III

Affiliations

Disruption of higher-order folding by core histone acetylation dramatically enhances transcription of nucleosomal arrays by RNA polymerase III

C Tse et al. Mol Cell Biol. 1998 Aug.

Abstract

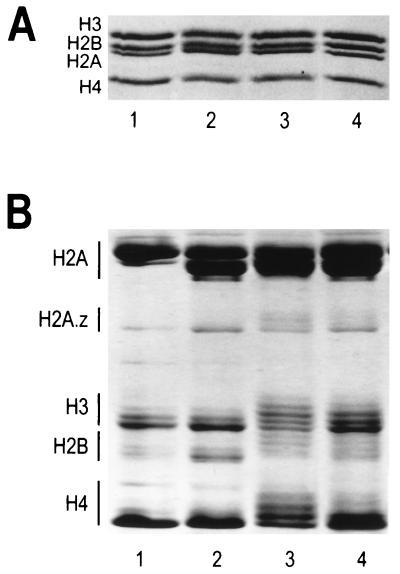
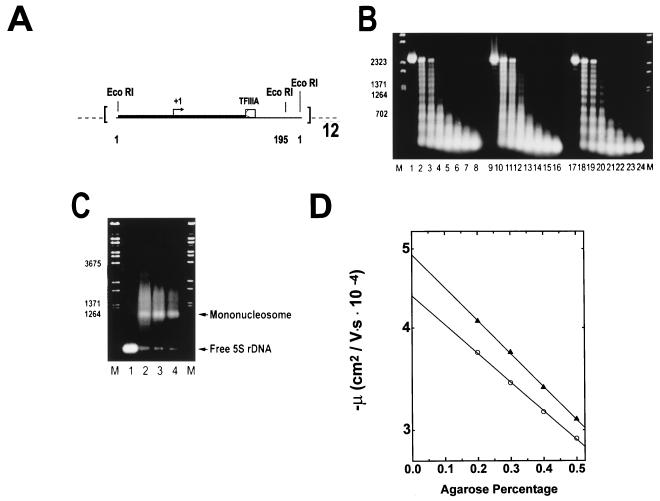
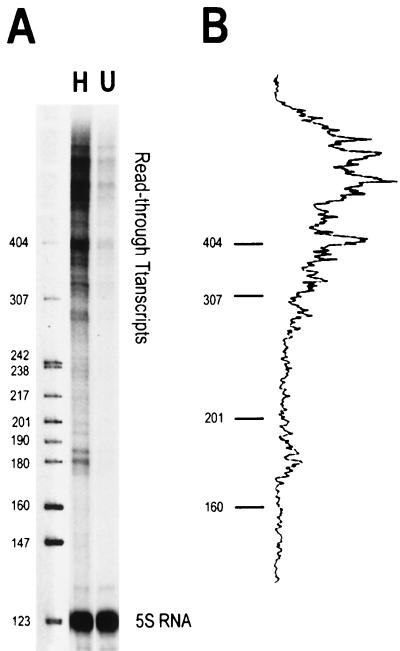
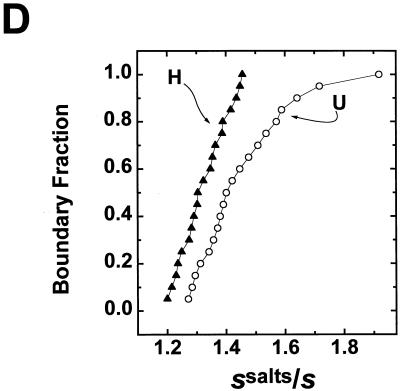
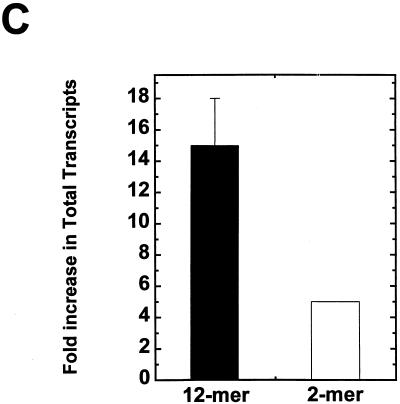
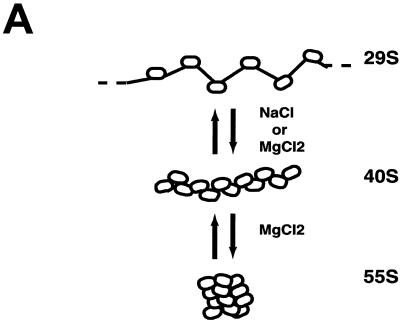
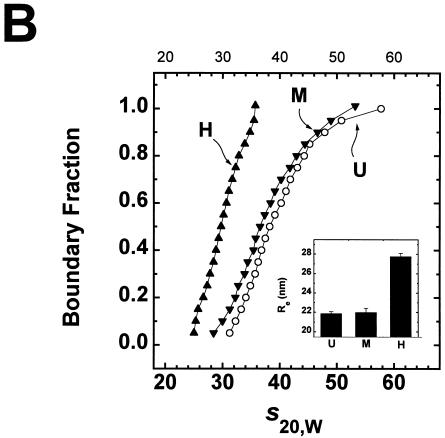
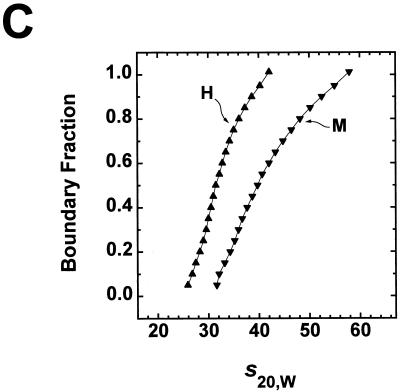
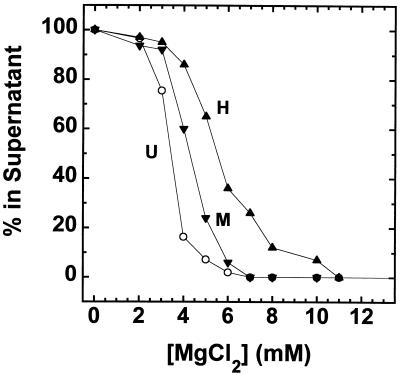
We have examined the effects of core histone acetylation on the transcriptional activity and higher-order folding of defined 12-mer nucleosomal arrays. Purified HeLa core histone octamers containing an average of 2, 6, or 12 acetates per octamer (8, 23, or 46% maximal site occupancy, respectively) were assembled onto a DNA template consisting of 12 tandem repeats of a 208-bp Lytechinus 5S rRNA gene fragment. Reconstituted nucleosomal arrays were transcribed in a Xenopus oocyte nuclear extract and analyzed by analytical hydrodynamic and electrophoretic approaches to determine the extent of array compaction. Results indicated that in buffer containing 5 mM free Mg2+ and 50 mM KCl, high levels of acetylation (12 acetates/octamer) completely inhibited higher-order folding and concurrently led to a 15-fold enhancement of transcription by RNA polymerase III. The molecular mechanisms underlying the acetylation effects on chromatin condensation were investigated by analyzing the ability of differentially acetylated nucleosomal arrays to fold and oligomerize. In MgCl2-containing buffer the folding of 12-mer nucleosomal arrays containing an average of two or six acetates per histone octamer was indistinguishable, while a level of 12 acetates per octamer completely disrupted the ability of nucleosomal arrays to form higher-order folded structures at all ionic conditions tested. In contrast, there was a linear relationship between the extent of histone octamer acetylation and the extent of disruption of Mg2+-dependent oligomerization. These results have yielded new insight into the molecular basis of acetylation effects on both transcription and higher-order compaction of nucleosomal arrays.


Figures

FIG. 1
FIG. 1
Analysis of core histone octamers purified from HeLa cells and chicken erythrocytes. (A) SDS-polyacrylamide gel electrophoresis. Two micrograms of purified histone octamers were electrophoresed on an SDS–18% polyacrylamide gel (37), and bands were visualized by staining with Coomassie blue G-250. Samples were loaded as follows: lane 1, chicken erythrocyte octamers; lane 2, underacetylated octamers isolated from untreated HeLa cells; lane 3, highly acetylated octamers isolated from fraction A of butyrate-treated HeLa cells (see Materials and Methods); lane 4, moderately acetylated octamers isolated from fraction C of butyrate-treated HeLa cells. (B) Resolution of acetylated histone species. Fifteen micrograms of the histone octamers from panel A were electrophoresed on a 6 M acetic acid–6 M urea–0.375% Triton X-100–polyacrylamide gel (12) for 16 h at 5 mA of constant current. The bands were visualized by Coomassie blue G-250 staining. Lanes 1 to 4 correspond to the same histone octamers as in panel A. Histones H2B, H3, and H4 each have four acetylation sites, while H2A has only one acetylation site (53). For each core histone (with the exception of H2A), increasing extents of acetylation lead to progressively slower band migration. In the case of histone H2A, the slower-migrating band corresponds to H2A.1 while the faster-migrating band corresponds to the H2A.2 variant (65).
FIG. 2
FIG. 2
Reconstitution of underacetylated, moderately acetylated, and highly acetylated 208-12 nucleosomal arrays. (A) Schematic illustration of the 208-12 DNA template used for reconstitution. The 208-12 DNA consists of 12 tandem repeats of a portion of the Lytechinus 5S rRNA gene (51). Each 5S rDNA repeat contains both a preferred nucleosome positioning site (solid box) and a TFIIIA binding site (open box). Initiation of transcription by RNA polymerase III occurs ∼90 bp upstream of the major TFIIIA binding site (+1, arrow). The termination sequence of the 5S rRNA gene was deleted during template construction (51), allowing for production of long read-through transcripts. EcoRI digestion sites are located at sequences 1 and 195 of each 5S rDNA repeat. (B) Micrococcal nuclease digestion. Underacetylated (lanes 1 to 8), highly acetylated (lanes 9 to 16), and moderately acetylated (lanes 17 to 24) reconstitutes were digested with 0.05 U of micrococcal nuclease per μg of DNA in the presence of 1 mM CaCl2. Digestion was for 0, 0.5, 1.0, 2.5, 5, 10, 20, and 30 min (shown from left to right for each reconstitute type) at room temperature. The reactions were quenched by addition of a 1/5 volume of 5% SDS–25% glycerol–10 mM EDTA–0.3% bromophenol blue. Samples were deproteinated by incubation at 37°C for 30 min and subsequently electrophoresed for 5 h at 2 V/cm in a 1% agarose gel buffered with 40 mM Tris-acetate–1 mM EDTA (pH 8.0). Bands were visualized under UV illumination after incubation of the gel in ethidium bromide. Lambda DNA digested with BstEII (lanes M) was used for the size markers. (C) EcoRI digestion. One microgram (each) of naked 208-12 DNA (lane 1) and underacetylated, highly acetylated, and moderately acetylated nucleosomal arrays (lanes 2 to 4, respectively) was digested with 10 U of EcoRI for 60 min at room temperature in digestion buffer H (Promega). Reactions were quenched by addition of a 1/5 volume of 25% glycerol–10 mM EDTA (pH 8.0). Digestion products were electrophoresed at 4 V/cm for 3 h in a 1% agarose gel buffered with 40 mM Tris-acetate–1 mM EDTA (pH 8.0). Lambda DNA digested with BstEII (lanes M) was used for the size markers. (D) Determination of μ0. Shown are plots of the mobilities in 0.2 to 0.5% agarose of underacetylated (○) and highly acetylated (▴) nucleosomal arrays in E buffer. The μ0 was determined from the extrapolated gel-free mobilities as described in Materials and Methods.
FIG. 3
FIG. 3
Highly acetylated histones enhance transcription and disrupt folding of 208-12 nucleosomal arrays in transcription buffer. (A) In vitro transcription. Underacetylated (U) and highly acetylated (H) nucleosomal arrays were transcribed in Xenopus oocyte nuclear extracts as described in Materials and Methods. A histone-free plasmid containing one copy of the Xenopus 5S RNA gene (which produces a 120-nt transcript) was included in each reaction as an internal control. Transcription reactions were electrophoresed in a denaturing 9% polyacrylamide gel. After electrophoresis, RNA products were visualized with a Molecular Dynamics PhosphorImager. MspI-digested pBR322 was utilized as the size marker. (B) Densitometric trace of the RNA transcripts produced from the highly acetylated arrays shown in panel A. (C) Densitometric quantitation of the total amount of RNA transcripts produced from the highly acetylated nucleosomal arrays (solid bar) expressed as the fold increase over the underacetylated controls. Also shown is the fold increase previously reported by Ura et al. (58) for hyperacetylated dinucleosomes (open bar). (D) Sedimentation velocity analysis of nucleosomal array folding in transcription buffer. Highly acetylated (▴) and underacetylated (○) nucleosomal arrays were incubated in either transcription buffer or transcription buffer containing 50 mM KCl and 7 mM MgCl2 for 1 h at room temperature. For these experiments, the nucleoside triphosphates in transcription buffer were replaced with 2 mM Na5PPPi to avoid interference with the absorbance optical system of the analytical ultracentrifuge as previously described (30, 31). Samples were sedimented at 18,000 rpm in an An-Ti60 rotor, and 20 boundary scans were collected. The temperature of the run was 21°C. Each boundary was divided into 20 equal fractions. The diffusion-corrected sedimentation coefficient at each boundary division was determined by the method of van Holde and Weischet (62), and the data were plotted as boundary fraction versus s20,w to yield the integral distribution of sedimentation coefficients present in the sample. For both highly acetylated and underacetylated samples, at each boundary fraction the data are expressed as the ratios of the s20,w in transcription buffer containing 50 mM KCl and 7 mM MgCl2 divided by the s20,w in transcription buffer lacking salts (ssalts/s) to yield the salt-dependent increase in s20,w across the entire distribution (30, 31). The ssalts/s expected if no folding occurred is 1.0, while a ratio >1.0 is indicative of folding (see text).
FIG. 3
FIG. 3
Highly acetylated histones enhance transcription and disrupt folding of 208-12 nucleosomal arrays in transcription buffer. (A) In vitro transcription. Underacetylated (U) and highly acetylated (H) nucleosomal arrays were transcribed in Xenopus oocyte nuclear extracts as described in Materials and Methods. A histone-free plasmid containing one copy of the Xenopus 5S RNA gene (which produces a 120-nt transcript) was included in each reaction as an internal control. Transcription reactions were electrophoresed in a denaturing 9% polyacrylamide gel. After electrophoresis, RNA products were visualized with a Molecular Dynamics PhosphorImager. MspI-digested pBR322 was utilized as the size marker. (B) Densitometric trace of the RNA transcripts produced from the highly acetylated arrays shown in panel A. (C) Densitometric quantitation of the total amount of RNA transcripts produced from the highly acetylated nucleosomal arrays (solid bar) expressed as the fold increase over the underacetylated controls. Also shown is the fold increase previously reported by Ura et al. (58) for hyperacetylated dinucleosomes (open bar). (D) Sedimentation velocity analysis of nucleosomal array folding in transcription buffer. Highly acetylated (▴) and underacetylated (○) nucleosomal arrays were incubated in either transcription buffer or transcription buffer containing 50 mM KCl and 7 mM MgCl2 for 1 h at room temperature. For these experiments, the nucleoside triphosphates in transcription buffer were replaced with 2 mM Na5PPPi to avoid interference with the absorbance optical system of the analytical ultracentrifuge as previously described (30, 31). Samples were sedimented at 18,000 rpm in an An-Ti60 rotor, and 20 boundary scans were collected. The temperature of the run was 21°C. Each boundary was divided into 20 equal fractions. The diffusion-corrected sedimentation coefficient at each boundary division was determined by the method of van Holde and Weischet (62), and the data were plotted as boundary fraction versus s20,w to yield the integral distribution of sedimentation coefficients present in the sample. For both highly acetylated and underacetylated samples, at each boundary fraction the data are expressed as the ratios of the s20,w in transcription buffer containing 50 mM KCl and 7 mM MgCl2 divided by the s20,w in transcription buffer lacking salts (ssalts/s) to yield the salt-dependent increase in s20,w across the entire distribution (30, 31). The ssalts/s expected if no folding occurred is 1.0, while a ratio >1.0 is indicative of folding (see text).
FIG. 4
FIG. 4
Comparison of Mg2+-dependent folding of underacetylated, moderately acetylated, and highly acetylated nucleosomal arrays. (A) Illustration of the salt-dependent folding of the 208-12 nucleosomal array as elucidated by sedimentation velocity experiments (27, 48). Shown are schematic representations of array conformations whose extent of compaction would yield the indicated sedimentation coefficients. (B) Sedimentation velocity analysis of underacetylated (U), moderately acetylated (M), and highly acetylated (H), nucleosomal arrays in 2 mM Mg2+. Samples were incubated in TE buffer containing 2 mM free Mg2+ for 1 h at room temperature. Sedimentation was performed as described in the legend for panel D of Fig. 3. Shown are the sedimentation coefficient distributions obtained after analysis of the data by the method of van Holde and Weischet (62). The inset shows the Res of the same samples determined by quantitative agarose gel analysis in E buffer containing 2 mM free Mg2+ (see Materials and Methods). The indicated values represent the means ± standard deviations of 18 determinations of the Re in 0.2 to 0.8% agarose gels (Pe ≥200 nm). At Pe ≥200 nm, the Res of 208-12 nucleosomal arrays is constant (20, 26). (C) Sedimentation velocity analysis of moderately acetylated (M) and highly acetylated (H) nucleosomal arrays in 3 mM Mg2+. Samples were incubated in TE buffer containing 3 mM free Mg2+ for 1 h at room temperature. Sedimentation was performed as described in the legend for panel D of Fig. 3. Shown are the sedimentation coefficient distributions obtained after analysis of the data by the method of van Holde and Weischet (62).
FIG. 4
FIG. 4
Comparison of Mg2+-dependent folding of underacetylated, moderately acetylated, and highly acetylated nucleosomal arrays. (A) Illustration of the salt-dependent folding of the 208-12 nucleosomal array as elucidated by sedimentation velocity experiments (27, 48). Shown are schematic representations of array conformations whose extent of compaction would yield the indicated sedimentation coefficients. (B) Sedimentation velocity analysis of underacetylated (U), moderately acetylated (M), and highly acetylated (H), nucleosomal arrays in 2 mM Mg2+. Samples were incubated in TE buffer containing 2 mM free Mg2+ for 1 h at room temperature. Sedimentation was performed as described in the legend for panel D of Fig. 3. Shown are the sedimentation coefficient distributions obtained after analysis of the data by the method of van Holde and Weischet (62). The inset shows the Res of the same samples determined by quantitative agarose gel analysis in E buffer containing 2 mM free Mg2+ (see Materials and Methods). The indicated values represent the means ± standard deviations of 18 determinations of the Re in 0.2 to 0.8% agarose gels (Pe ≥200 nm). At Pe ≥200 nm, the Res of 208-12 nucleosomal arrays is constant (20, 26). (C) Sedimentation velocity analysis of moderately acetylated (M) and highly acetylated (H) nucleosomal arrays in 3 mM Mg2+. Samples were incubated in TE buffer containing 3 mM free Mg2+ for 1 h at room temperature. Sedimentation was performed as described in the legend for panel D of Fig. 3. Shown are the sedimentation coefficient distributions obtained after analysis of the data by the method of van Holde and Weischet (62).
FIG. 5
FIG. 5
Mg2+-dependent oligomerization of underacetylated, moderately acetylated, and highly acetylated nucleosomal arrays. Oligomerization was assayed by differential centrifugation as previously described (47, 48). Shown are the percentages of the underacetylated (U), moderately acetylated (M), and highly acetylated (H); samples that remained in the supernatant after exposure to the indicated amounts of MgCl2 for 10 min at room temperature and centrifugation at 16,000 × g for 10 min in an Eppendorf microcentrifuge. Each data point represents the mean of three to four determinations.

References

    1. Allan J, Harborne N, Rau D C, Gould H. Participation of core histone “tails” in the stabilization of the chromatin solenoid. J Cell Biol. 1982;93:285–297. - PMC - PubMed
    1. Alland L, Muhle R, Hou H, Jr, Potes J, Chin L, Schreiber-Agus N, DePinho R A. Role for N-CoR and histone deacetylase in Sin3-mediated transcriptional repression. Nature. 1997;387:49–55. - PubMed
    1. Allfrey V, Faulkner R M, Mirsky A E. Acetylation and methylation of histones and their possible role in the regulation of RNA synthesis. Proc Natl Acad Sci USA. 1964;51:786–794. - PMC - PubMed
    1. Annunziato A T, Frado L L, Seale R L, Woodcock C L. Treatment with sodium butyrate inhibits the complete condensation of interphase chromatin. Chromosoma. 1988;96:132–138. - PubMed
    1. Ausio J, van Holde K E. Histone hyperacetylation: its effects on nucleosome conformation and stability. Biochemistry. 1986;25:1421–1428. - PubMed

Publication types