. 1998 Aug 1;18(15):5586-93.
doi: 10.1523/JNEUROSCI.18-15-05586.1998.

Cloning and functional expression of an Aplysia 5-HT receptor negatively coupled to adenylate cyclase

Affiliations

Cloning and functional expression of an Aplysia 5-HT receptor negatively coupled to adenylate cyclase

A Angers et al. J Neurosci. .

Abstract

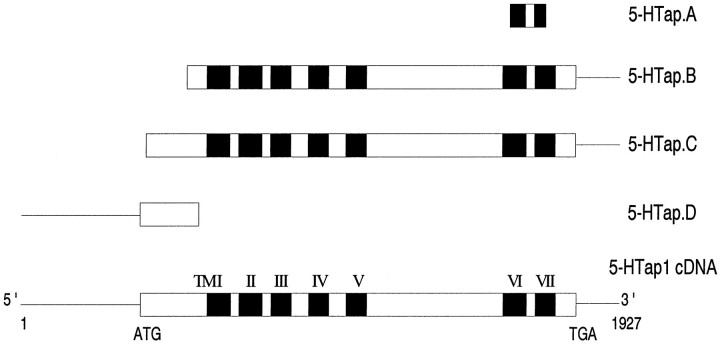
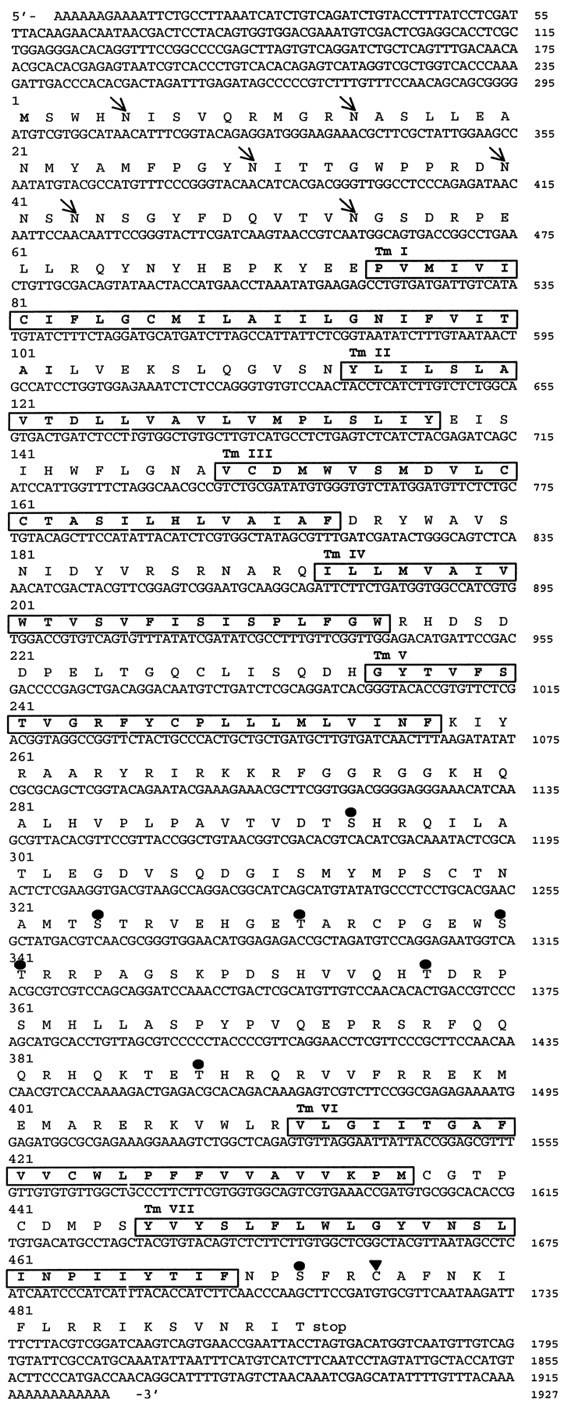
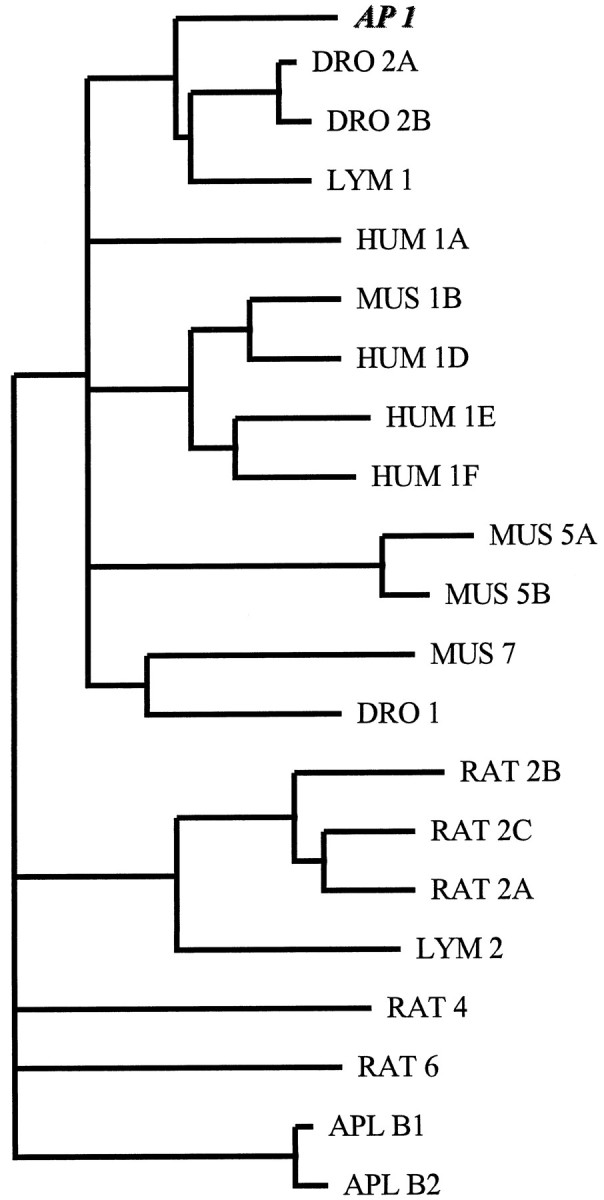
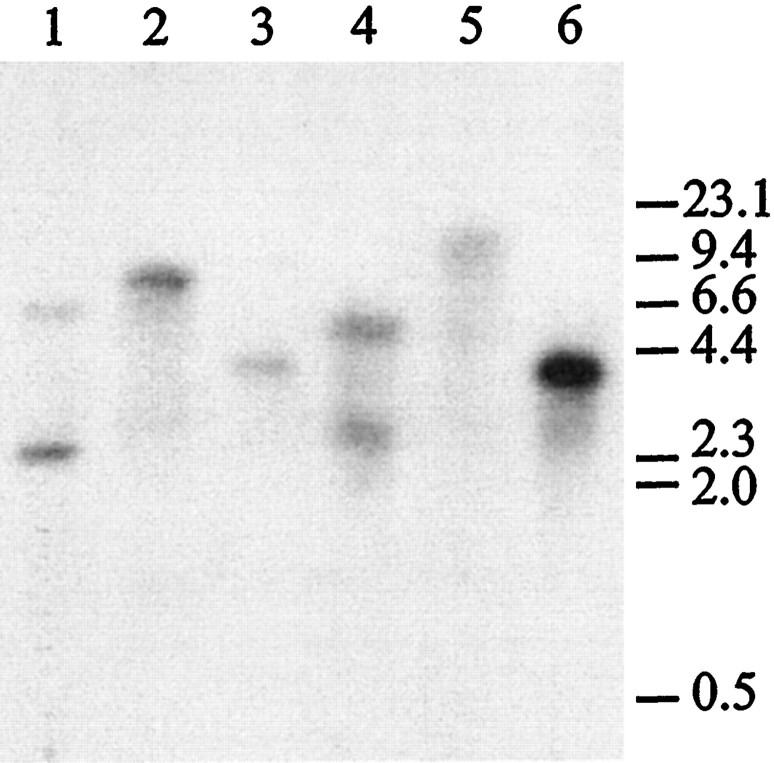
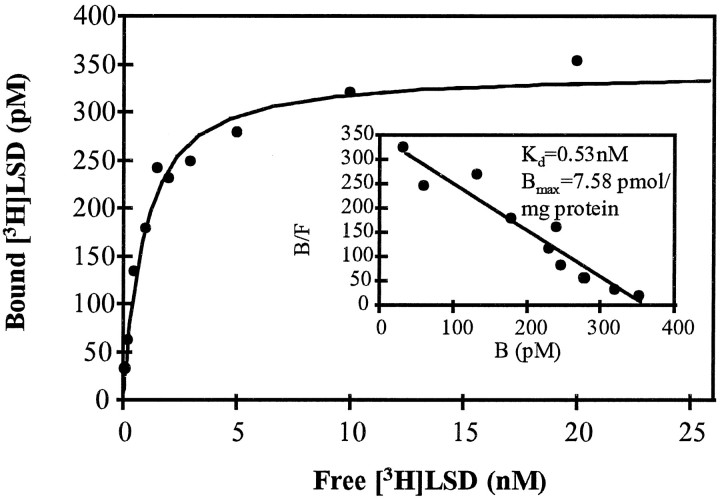
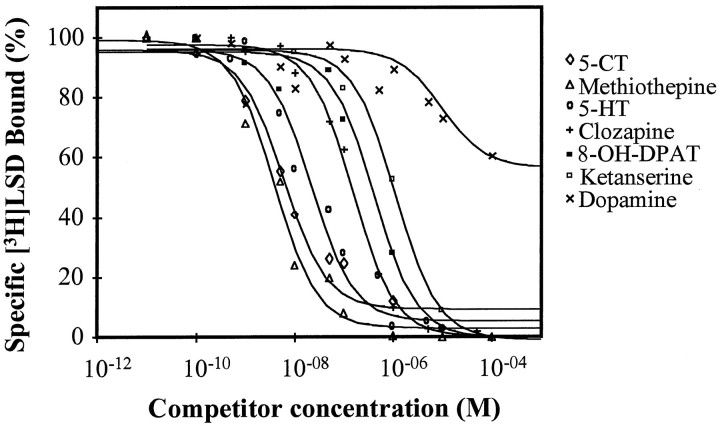
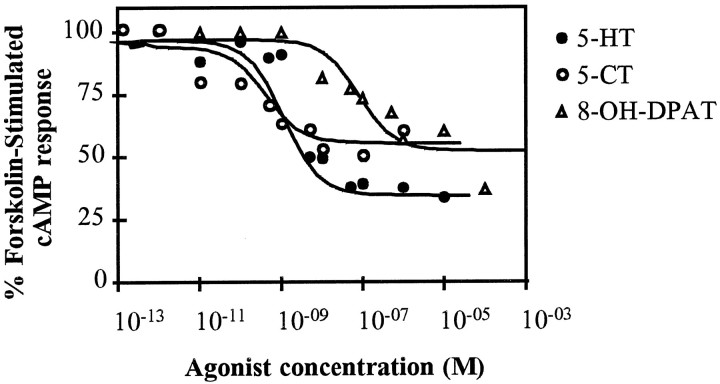
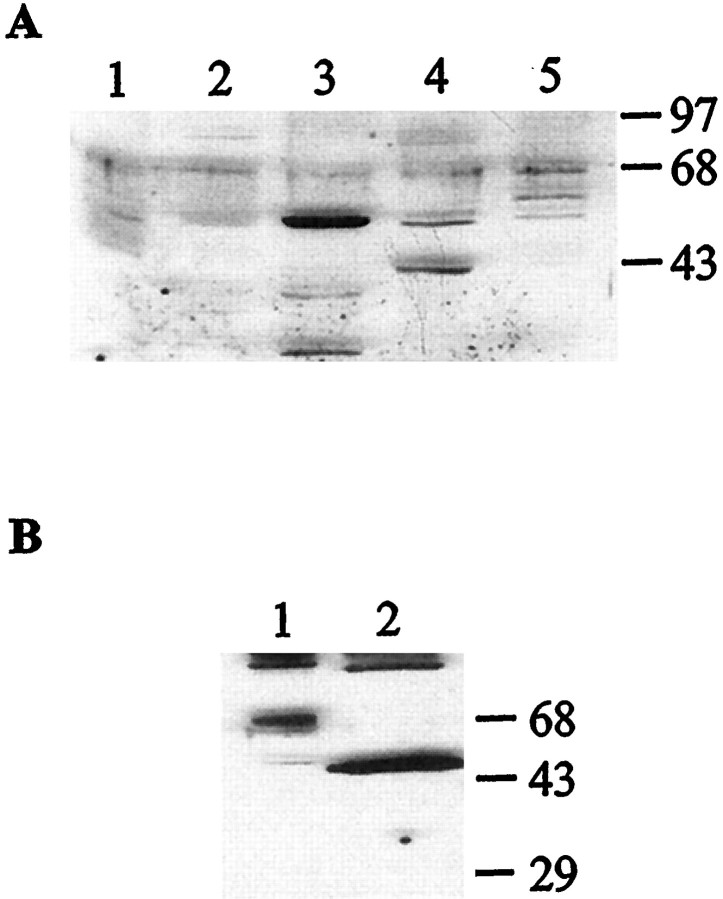
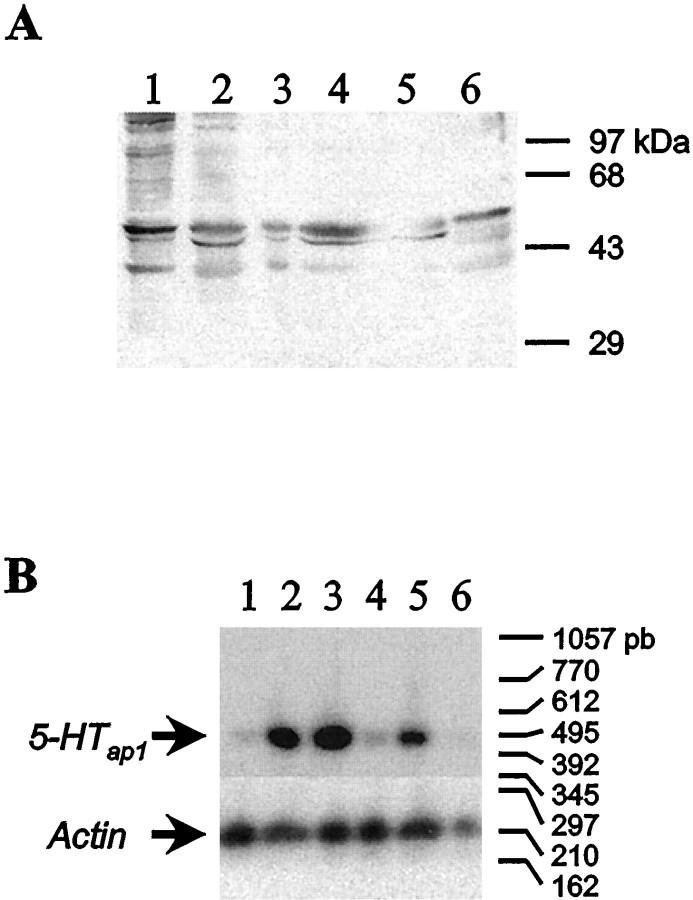
Serotonin (5-HT) is involved in the control of various behaviors in Aplysia californica, including reproduction, feeding, locomotion, circadian rhythm, synaptic plasticity, and synaptic growth. The large variety of functions of 5-HT is mediated by different receptor subtypes that are coupled to different second-messenger systems. Here, we report the cloning of a cDNA coding for an Aplysia G-protein-coupled 5-HT receptor (5-HTap1). Its deduced amino acid sequence resembles those of the 5-HT1 receptor subfamily. When expressed in stable cell lines, 5-HTap1 exhibits high-affinity binding for the serotonergic radioligand [N-methyl-3H]lysergic acid diethylamide. This binding is competed by several 5-HT agonists and antagonists, and the pharmacological profile of inhibition has some similarities with those of 5-HT1 and 5-HT7 receptors. Application of 5-HT or its agonists 5-carboxamidotryptamine maleate and (+/-)-8-hydroxy-2-(di-n-propyl-amino) tetralin hydrobromide on cells transformed with 5-HTap1 produced a dose-dependent inhibition of forskolin-stimulated cAMP accumulation. 5-HTap1 is thus negatively coupled to adenylate cyclase. The production of antiserum against the 5-HTap1 receptor allowed us to examine its expression in animal tissues. The receptor protein is detected in every tissue examined, although it seems only weakly expressed in some samples. The receptor is also found in every ganglia of the nervous system, both in the sheath and in the neurons. 5-HTap1 mRNA is absent from the sheath, indicating that the protein observed there is probably located on the nerve terminals.


Figures

Fig. 1.
Fig. 1.
Molecular cloning of the 5-HTap1receptor cDNA. The 5-HTap.A fragment was PCR-amplified from DNA isolated from CNS and kidney cDNA libraries, using degenerate primers. The 5-HTap.B and 5-HTap.C cDNAs were isolated from a kidney cDNA library using a PCR-screening strategy (Israel, 1993). The 5-HTap.D was PCR-amplified from DNA isolated from the kidney cDNA library using nested antisense 5-HTap1-specific primers and a sense (GT10-specific) primer. The reconstituted full-length cDNA is schematized at thebottom. The open reading frame is represented byboxes, and the putative transmembrane domains are indicated by the dark regions. The linesrepresent the 5′ and 3′ untranslated regions of the transcript.
Fig. 2.
Fig. 2.
Nucleotide and deduced amino acid sequence of the 5-HTap1 cDNA. Putative transmembrane regions areboxed and numbered TMI–VII.Arrows indicate the position of consensus sites for N-linked glycosylation. Serines and threonines that are within a consensus sequence for phosphorylation by protein kinase C are indicated by circles (•). A potential palmitoylation site is indicated by a triangle (▴). The nucleotide sequence is available in the GenBank database under accession numberAF041039.
Fig. 3.
Fig. 3.
Phylogenetic analysis of 5-HT receptors. Amino acid sequences of 5-HT receptors were retrieved from the GenBank database. Their amino acid sequence, excluding their N termini and their third cytoplasmic loops, were aligned with the corresponding amino acid sequence of 5-HTap1, using the ClustalW package (Thompson et al., 1994). The alignment was then used for phylogenetic comparisons using the PHYLIP package (J. Felsenstein, 1993, PHYLIP 3.5.1c; University of Washington, Seattle, WA). Analysis was performed with a bootstrap procedure that computes the probability of occurrence of the branches for 100 possible trees. Branching order was determined using the Fitch-Margoliash algorithm included in the PHYLIP package. Only branches occurring in >80 trees are represented.HUM, human; MUS, mouse; RAT, rat.
Fig. 4.
Fig. 4.
Southern blot analysis of the 5-HTap1gene. Genomic DNA was isolated from ovotestis, purified, and digested with BamHI (lane 1), BglII (lane 2), EcoRI (lane 3),HindIII (lane 4),SacI (lane 5), or XbaI (lane 6), as described previously (Wickham and DesGroseillers, 1991). Digested DNA was run on a 1% agarose gel, transferred to a Hybond N+ membrane, and hybridized with a32P-labeled 5-HTap.B cDNA fragment (nt 457–1927).BglII, EcoRI, SacI, andXbaI sites are not present in the probe sequence, whereas BamHI and HindIII appear once. The molecular weight marker is λ phage DNA digested withHindIII. The molecular weights are indicated in kilobase pairs.
Fig. 5.
Fig. 5.
Saturation analysis of [3H]LSD binding on the 5-HTap1receptor. Membranes harvested from stable cell lines expressing 5-HTap1 were incubated with increasing concentrations of [3H]LSD (0.1–20 nm) for 1 hr at room temperature. Nonspecific binding was defined in the presence of 10 μm unlabeled methiothepin. Results are those of a single experiment, but similar results were obtained in six different binding experiments. The Kd andBmax values were determined with the AllFit for Windows 2.1 computer program (C. De Léan and A. De Léan, 1993, Université de Montréal, Montréal, Québec, Canada). Inset, Scatchard plot of the same data.
Fig. 6.
Fig. 6.
Inhibition of specific [3H]LSD binding to the Aplysia5-HTap1 receptor. Membranes from stable cell lines expressing 5-HTap1 were incubated with 1.5 nm[3H]LSD in the presence or absence of increasing concentrations of unlabeled competitors. Nonspecific binding was defined in the presence of 10 μm unlabeled methiothepin. Results at each concentration are presented as a percentage of the specific binding in the absence of the competitor. Results are from a single experiment but are representative of three such experiments. Data were analyzed by a computer-assisted nonlinear analysis (C. De Léan and A. De Léan, 1993, AllFit for Windows 2.1; Université de Montréal).
Fig. 7.
Fig. 7.
5-HT- and agonist-induced decrease in cAMP levels in cell lines expressing the 5-HTap1 receptor. cAMP levels are expressed as a percentage of the value obtained with 2.5 μm forskolin (100%) in the absence of 5-HT or agonists. The values are the mean of an experiment done in triplicate and are representative of three such experiments. Data were analyzed by a computer-assisted nonlinear analysis (C. De Léan and A. De Léan, 1993, AllFit for Windows 2.1; Université de Montréal).
Fig. 8.
Fig. 8.
Western blot analysis of the expression of the 5-HTap1 receptor in different Aplysiatissues. Proteins were resolved by SDS-PAGE and analyzed by immunoblotting with antiserum raised against the third cytoplasmic loop of the 5-HTap1 receptor. A, Thirty micrograms of cytoplasmic membrane protein extracts prepared from gill (lane 1), heart (lane 2), hermaphroditic duct (lane 3), kidney (lane 4), and ovotestis (lane 5). B, Fifty micrograms of kidney plasma membrane proteins before (lane 1) or after (lane 2) treatment with deglycosidase F to remove N-linked sugars. Molecular weight marker positions are indicated in kilodaltons.
Fig. 9.
Fig. 9.
Western blot and RT-PCR analysis of the expression of the 5-HTap1 receptor in the CNS. A, Fifty micrograms of total protein extracted from desheathed ganglia and sheath alone were resolved by SDS-PAGE and analyzed by immunoblotting with antiserum raised against the third cytoplasmic loop of the 5-HTap1 receptor. Abdominal (lane 1), buccal (lane 2), cerebral (lane 3), pedal (lane 4), and pleural (lane 5) ganglia from five animals were pooled. The sheath extract (lane 6) was prepared from a single animal. B, RT-PCR analysis was conducted on total RNA isolated from the same samples as in A. The PCR products were analyzed by Southern blotting probed with a 5-HTap1-specific oligonucleotide. The same procedure was followed for amplification of the control (actin). The sizes of the bands were estimated by comparison with the DNA size markers on the original ethidium bromide-stained gel.

Similar articles

Cited by

References

    1. Aloyz RS, DesGroseillers L. Processing of the L5–67 precursor peptide and characterization of LUQIN in the LUQ neurons of Aplysia californica. Peptides. 1995;16:331–338. - PubMed
    1. Andrade R, Malenka RC, Nicall RA. A G-protein couples serotonin and GABAB receptors to the same channels in hippocampus. Science. 1986;234:1261–1265. - PubMed
    1. Angers A, DesGroseillers L. Alternative splicing and genomic organization of the L567 gene of Aplysia californica. Gene. 1998;208:271–277. - PubMed
    1. Ansanay H, Sebben M, Bockaert J, Dumuis A. Characterization of homologous 5-hydroxytryptamine4 receptor desensitization in colliculi neurons. Mol Pharmacol. 1992;42:808–816. - PubMed
    1. Bacskai BJ, Hochner B, Mahaut-Smith M, Adams SR, Kaang BK, Kandel ER, Tsien RY. Spatially resolved dynamics of cAMP and protein kinase A subunits in Aplysia sensory neurons. Science. 1993;260:222–226. - PubMed

Publication types

Associated data

LinkOut - more resources