. 1998 Aug 1;18(15):5673-81.
doi: 10.1523/JNEUROSCI.18-15-05673.1998.

Biochemical and morphometric analyses show that myelination in the insulin-like growth factor 1 null brain is proportionate to its neuronal composition

Affiliations

Biochemical and morphometric analyses show that myelination in the insulin-like growth factor 1 null brain is proportionate to its neuronal composition

C M Cheng et al. J Neurosci. .

Abstract

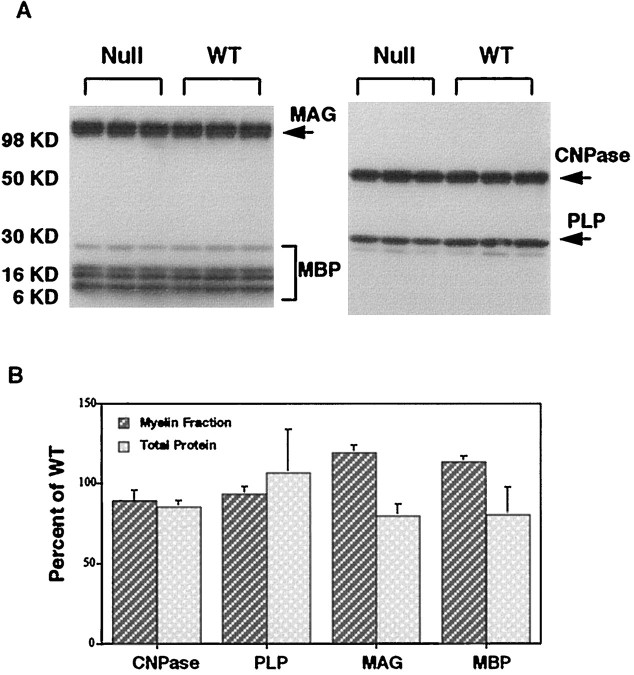
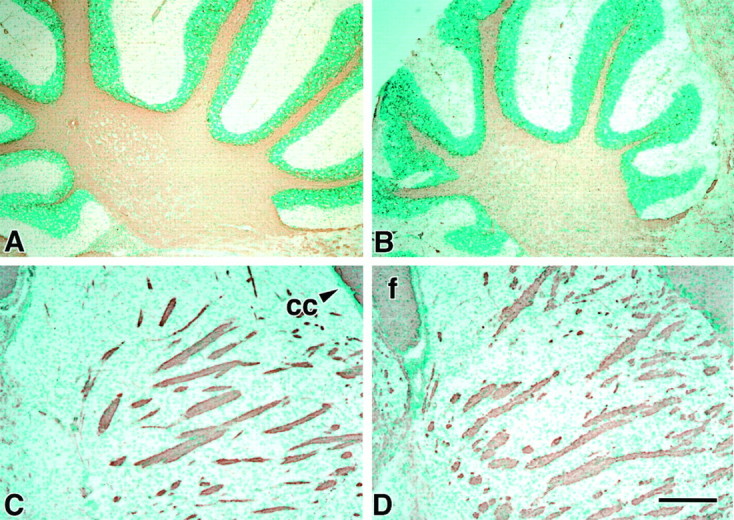
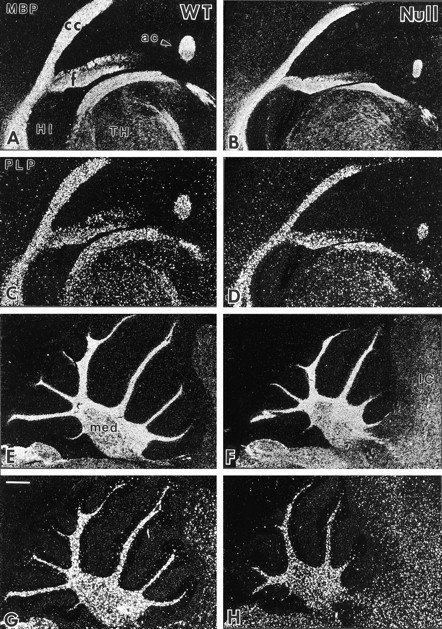
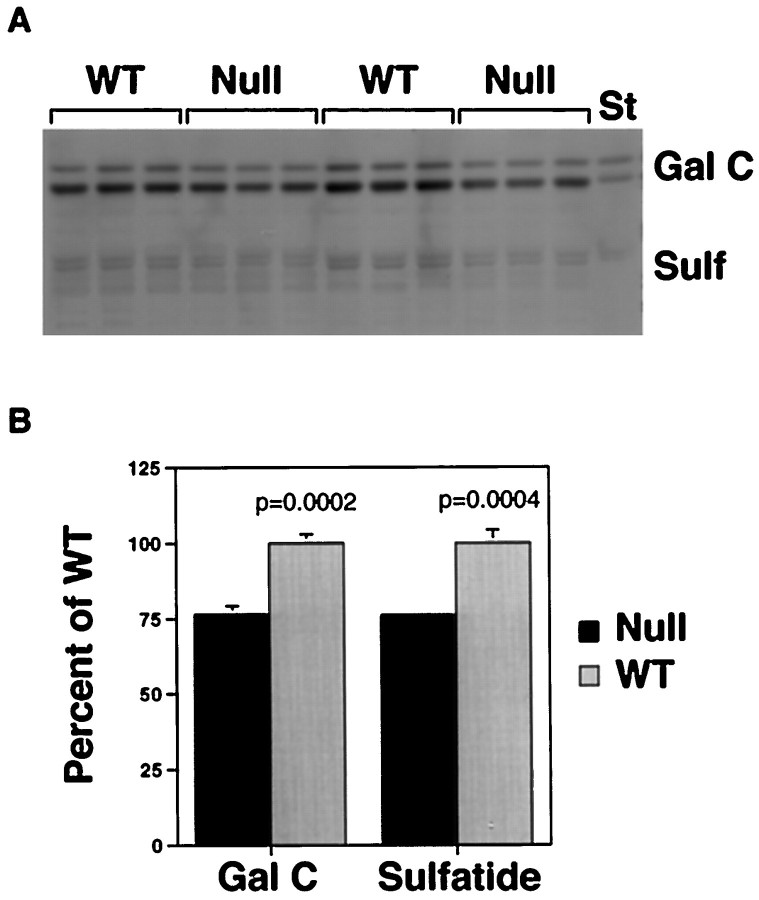
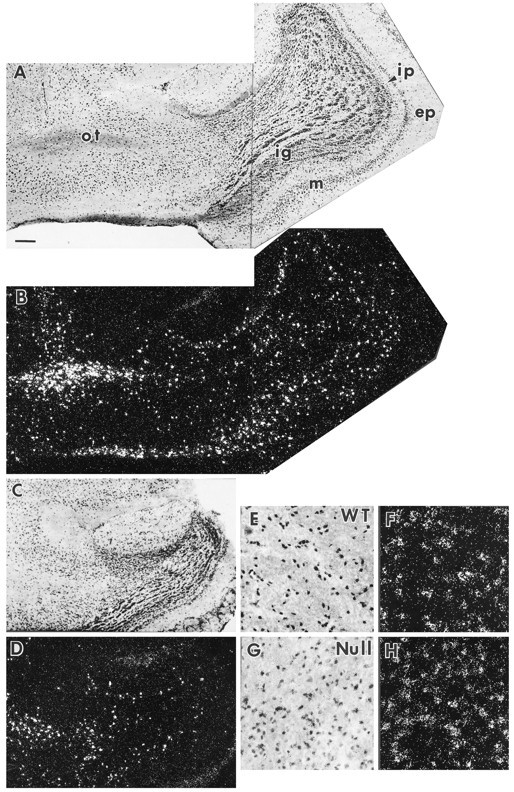
To elucidate the role of insulin-like growth factor 1 (IGF1) in the normal development of brain myelination, we used behavioral, biochemical, and histological analyses to compare the myelination of brains from Igf1(-/-) and wild-type (WT) littermate mice. The studies were conducted at postnatal day 40, at which time the Igf1(-/-) mice weighed approximately 66% less than wild-type mice. However, the Igf1(-/-) brain weight was only reduced by approximately 34%. Formal neurological testing showed no sign of central or peripheral myelinopathy in Igf1(-/-) mice. Myelin composition was not significantly different, and myelin concentration, normalized to brain weight or protein, was equal in Igf1(-/-) and WT mice. Likewise, concentrations of myelin-specific proteins (MBP, myelin proteolipid protein, MAG, and 2',3'-cyclic nucleotide,3'-phosphodiesterase) were not significantly different in Igf1(-/-) and WT mice. The myelin-associated lipids galactocerebroside and sulfatide were modestly reduced in Igf1(-/-) brains. Regional oligodendrocyte populations and myelin staining patterns were comparable in Igf1(-/-) and WT brains, with the notable exception of the olfactory system. The Igf1(-/-) olfactory bulb was profoundly reduced in size and was depleted of mitral neurons and oligodendrocytes, and its efferent tracts were depleted of myelin. In summary, this study shows that myelination of the Igf1(-/-) brain is proportionate to its neuronal composition. Where projection neurons are preserved despite the deletion of IGF1, as in the cerebellar system, oligodendrocytes and myelination are indistinguishable from wild type. Where projection neurons are depleted, as in the olfactory bulb, oligodendrocytes are also depleted, and myelination is reduced in proportion to the reduced projection neuron mass. These data make a strong case for the primacy of axonal factors, not including IGF1, in determining oligodendrocyte survival and myelination.


Figures

Fig. 1.
Fig. 1.
Immunoblot analysis of myelin-specific proteins inIgf1−/−(Null) and wild-type (WT) brains. A, Representative immunoblots of myelin fraction proteins isolated by sucrose density gradient centrifugation and separated on 4–20% polyacrylamide gels. The proteins were blotted onto nitrocellulose membranes and probed with antibodies against MAG, MBP (left), CNPase, and PLP (right). The bands representing these proteins are marked by arrowsand appear at the positions of expected molecular weight: MAG, 100 kDa; MBP, 14, 17, 18, and 21.5 kDa; CNPase, 48 kDa; PLP, 25 kDa. These blots show data from three WT and threeIgf1−/− mice; similar results were obtained with additional groups. B, Quantitation of CNPase, PLP, MAG, and MBP levels determined by immunoblotting of total brain protein and brain myelin fractions. Protein bands from the blots shown in A and blots from other independent trials were quantified using computer-assisted image analysis. Data are expressed as mean ± SEM of percentage of WT values (n = 6 for both WT and Igf1−/− groups). None of the values represents a significant difference betweenIgf1−/− and wild type.
Fig. 2.
Fig. 2.
Immunohistochemical comparison of the regional expression of PLP in WT (A, C) andIgf1−/− brains (B,D). Anatomically matched sagittal P40 brain sections were probed by anti-PLP antibodies visualized with 3,3′-diaminobenzidine (brown) and counterstained with methyl green. Micrographs show the homogeneous distribution of PLP in myelinated tracts of the cerebellum (A,B) and striatum (C, D).cc, Corpus callosum; f, fimbria. Scale bar, 200 μm.
Fig. 3.
Fig. 3.
Comparison of PLP and MBP gene expression in the anterior forebrain and cerebellum of wild-type (WT,left panels) andIgf1−/− mice (Null,right panels) by in situ hybridization. Serial sagittal brain sections of WT andIgf1−/− brains were hybridized to35S-labeled oligomer probes for MBP (A,B, E, F) and PLP (C, D, G,H). Dark-field micrographs show the hybridization signal as white grains. ac, Anterior commissure;cc, corpus callosum; f, fimbria;HI, hippocampal formation; IC, inferior colliculus; med, cerebellar medulla; TH, thalamus. Scale bar, 400 μm.
Fig. 4.
Fig. 4.
Myelin lipids in WT andIgf1−/− brains extracted from equal amounts of total protein demonstrated by thin layer chromatography. Orcinol-stained bands are identified as galactocerebroside (Gal C) or sulfatide (Sulf) by comparison of the comigrating standards (St) in A. The bands were quantified by the NIH Image analysis program, and the results are expressed as mean ± SEM of percentage of wild type (B).
Fig. 5.
Fig. 5.
Luxol blue myelin staining in WT (A, C, E) andIgf1−/− (B,D, F) brains. A andB show the olfactory tract (ot) leading into the olfactory bulb at low magnification. The anterior and posterior limbs (al and pl, respectively) of the AC are seen on the left side of Aand B. C and D show ACs at higher magnification at a medial level in which two limbs have joined, showing that the anterior limb is deeply stained in the wild type but very faintly stained in theIgf1−/−. E andF compare Luxol staining in the cerebellum. The lipophilic Luxol stain is marine blue, and hematoxylin-stained nuclei are navy blue. Scale bar:A, B, E, F, 400 μm; C, D, 50 μm;E, F, 200 μm.
Fig. 6.
Fig. 6.
Oligodendrocyte concentration in olfactory bulb (A–D) and cerebellar medulla (E–H). PLP mRNA-positive cells are taken to be oligodendrocytes. In this figure, each bright-field micrograph is paired with a matching dark-field illumination showing the PLP mRNA-positive cells. The wild-type (WT) olfactory bulb (A, B) is much larger than that of the Igf1−/−(Null) (C, D). The number of mitral neurons and PLP mRNA-positive cells are both reduced in the Igf1−/−. ep, External plexiform layer; ig, internal granular layer;ip, internal plexiform layer; m, mitral cell layer; ot, olfactory tract. PLP mRNA-positive cells are shown at higher magnification on the cerebellar medulla of WT (E, F) andIgf1−/− (G,H) brain sections. Scale bar:A–D, 200 μm; E–H, 50 μm.

References

    1. Andersson IK, Edwall D, Norstedt G, Rozell B, Skottner A, Hansson H-A. Differing expression of insulin-like growth factor I in the developing rat cerebellum. Acta Physiol Scand. 1988;132:167–173. - PubMed
    1. Ayer-Le Lievre C, Stahlbom PA, Sara VR. Expression of IGF-I and -II mRNA in the brain and craniofacial region of the rat fetus. Development. 1991;111:105–115. - PubMed
    1. Barres BA, Hart IK, Coles HSR, Burne JF, Voyvodic JT, Richardson WD, Raff MC. Cell death and control of cell survival in the oligodendrocyte lineage. Cell. 1992;70:31–46. - PubMed
    1. Barres BA, Jacobson MD, Schmid R, Sendtner M, Raff MC. Does oligodendrocyte survival depend on axons? Curr Biol. 1993;3:489–497. - PubMed
    1. Barres BA, Raff MC. Proliferation of oligodendrocyte precursor cells depends on electrical activity in axons. Nature. 1993;361:258–260. - PubMed