. 1998 Aug 1;18(15):5777-88.
doi: 10.1523/JNEUROSCI.18-15-05777.1998.

Growth and fate of PSA-NCAM+ precursors of the postnatal brain

Affiliations

Growth and fate of PSA-NCAM+ precursors of the postnatal brain

T Ben-Hur et al. J Neurosci. .

Abstract

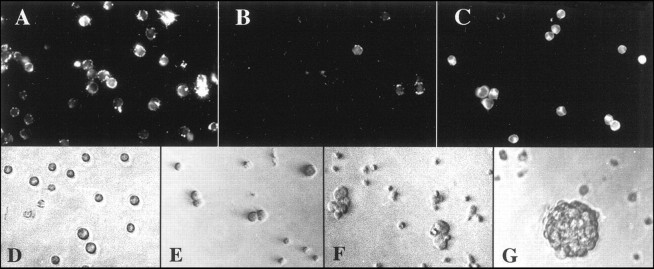
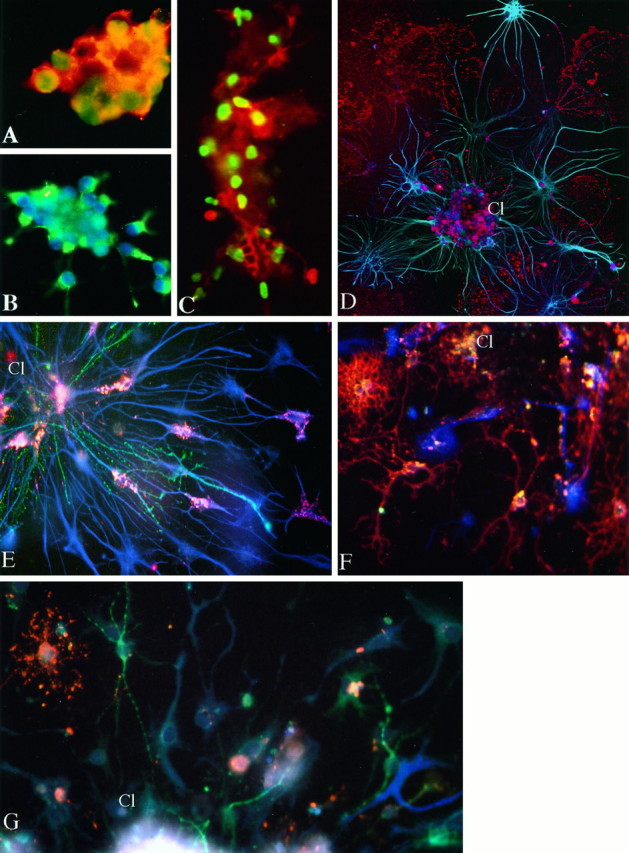
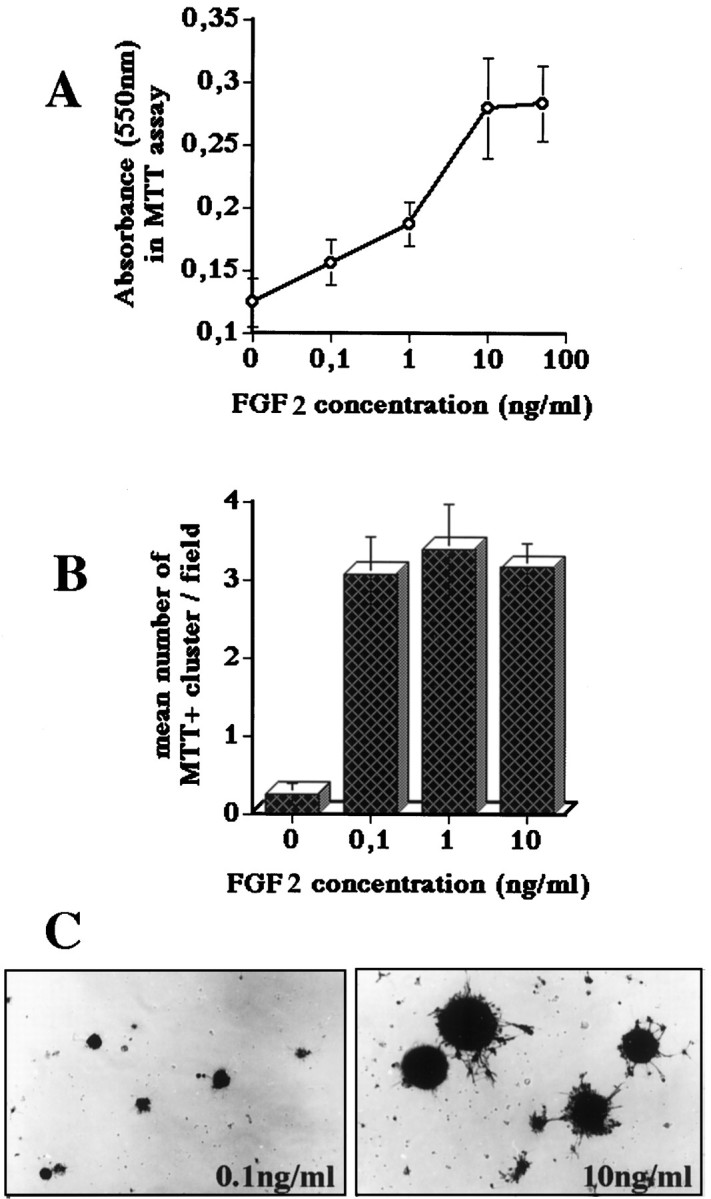
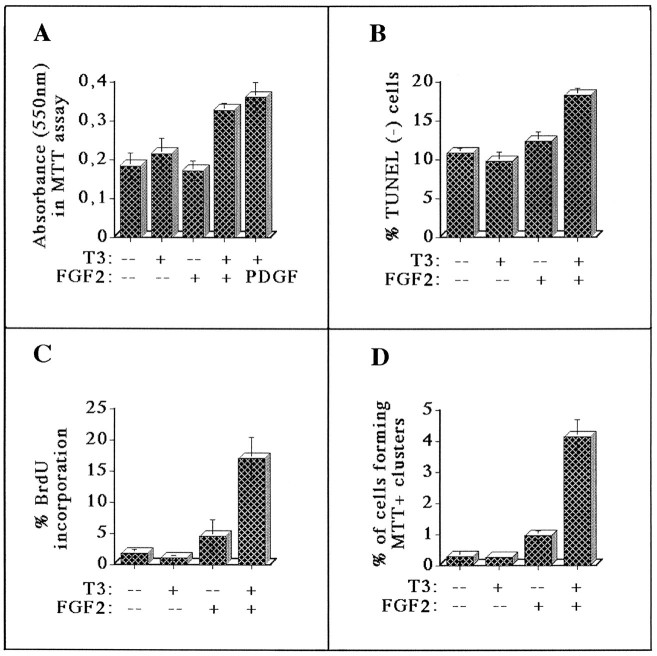
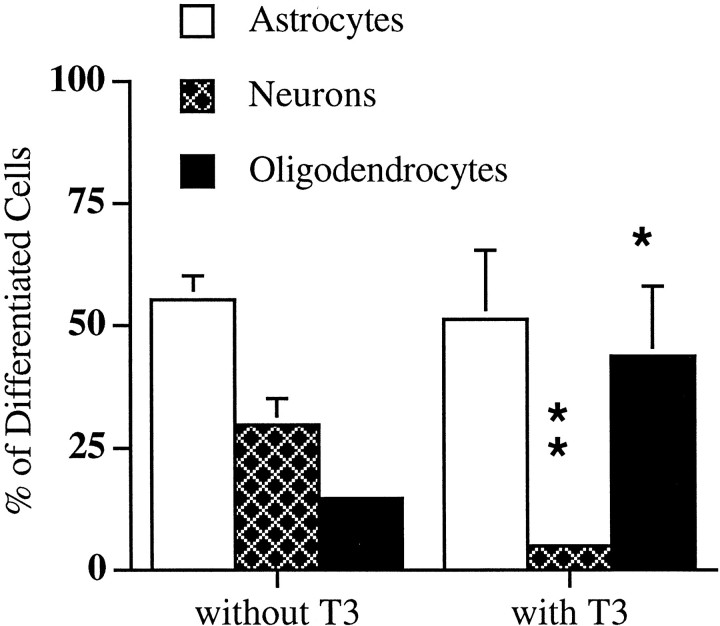
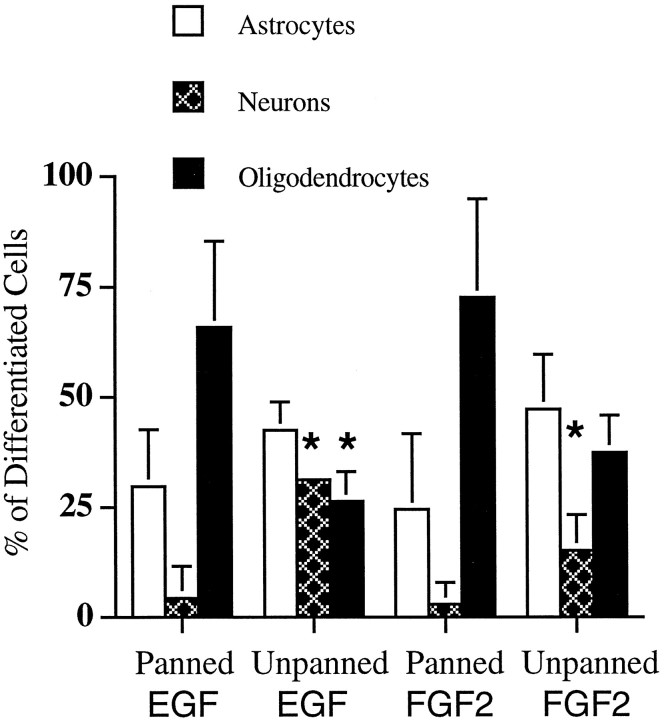
Oligodendrocyte-type 2 astrocyte (O-2A) lineage cells are derived from multipotential stem cells of the developing CNS. Precursors of O-2A progenitors express the polysialylated (PSA) form of the neural cell adhesion molecule (NCAM) and are detected in neonatal rat brain glial cultures. It is unclear how such PSA-NCAM+ "pre-progenitors" are related to neural stem cells and whether they still have the potential to differentiate along several neural lineages. Here we isolated PSA-NCAM+ pre-progenitor cells from glial cultures by immunopanning and found that most of these cells expressed nestin and PDGF-receptor-alpha but not O-2A antigens. PSA-NCAM+ cells synthesized transcripts for fibroblast growth factor (FGF) receptors 1, 2, and 3 and responded to FGF2 by survival and proliferation, growing into large clusters resembling neural spheres. FGF2-induced proliferation of PSA-NCAM+ pre-progenitors was significantly enhanced by thyroid hormone (T3), which on its own did not increase cell survival or mitosis. After adhesion and withdrawal of the mitogen, spheres generated mostly oligodendrocytes and astrocytes but very rarely neurons. PSA-NCAM immunopanned cells grown in epidermal growth factor (EGF) also adopted a mostly glial fate after differentiation. In contrast, PSA-NCAM-negative cells and striatal neonatal stem cells, grown in EGF or FGF2, generated the three CNS cell types. Like neural stem cells, PSA-negative cells generated more oligodendrocytes and fewer neurons when expanded in FGF2 and T3. Thus emergence of PSA-NCAM at the surface of neonatal brain precursors coincides with their restriction to a glial fate. T3 modulates these events by enhancing PSA-NCAM+ pre-progenitor growth in FGF2 and favoring an oligodendrocyte fate.


Figures

Fig. 1.
Fig. 1.
A–C, Immunofluorescence staining of neonatal neural precursors immediately after immunopanning.A, Of the cells identified by phase microscopy in this microscopic field, 32 of 36 (89%) are PSA-NCAM+. B, Only four cells (11%) in the same field are GD3+. C, In this other field, 13 of 15 cells are positive with clone HM-2 anti-MAP2, which detects MAP2abc isoforms. D–G, Phase micrographs showing progressive growth of PSA-NCAM+ immunopanned cells into clusters on a nonadherent surface, during the first week in culture with FGF2. D, The cells at plating day are separated into single cells: E, after 1 d, some cells have divided; F, after 3 d, there are small cell clusters; G, after 1 week, larger cell clusters are observed.
Fig. 2.
Fig. 2.
A–C, Mitosis and differentiation of neonatal neural precursors grown in EGF and FGF2. A, A typical proliferating cluster of PSA-NCAM+ cells (red) with many BrdU+ nuclei (green). B, Clusters of cells are nestin+ (green). Nuclei are counterstained with Hoechst (blue). C, EGF expanded clusters also had many PSA-NCAM+ cells (red) with BrdU+ nuclei (green), although a few of these are also associated with PSA-NCAM-negative cells (left). D–G, Migration and differentiation of neural precursors after adhesion were studied after triple labeling for 04/MAP2/GFAP except in E. Clusters were attached to glass to perform the staining and are indicated byCl. D, E, PSA-NCAM immunopanned cell cluster grown for 2 weeks in FGF2 and differentiated for 5 d. InD, many GFAP+ astrocytes (blue) have migrated out of the central cluster (Cl) and are surrounded by O4+ oligodendrocyte lineage cells (red) but no neurons (photomontage of 4 fields). E, After triple labeling for A2B5/GD3 and GFAP, another cluster (Cl) shows many GFAP+ (blue) type 1 astrocytes radiating from its center; some of these are type 2 astrocytes because they also stain with A2B5 Ab (red). GD3+ processes (green) of O-2A progenitors are radiating out of the cluster. F, PSA immunopanned neural precursors grown in EGF and differentiated for 7 d also show glial populations of astrocytes (blue) and oligodendrocytes (red) in the outgrowth. No neurons were formed by this cluster. G, In contrast, PSA-NCAM-negative (unpanned cells) neural precursors grown in EGF give rise to neurons (MAP2,green), astrocytes (blue), or oligodendrocytes (red) (see Fig. 6). Similar results were obtained with striatal neural stem cells (see Fig. 7). Magnification: A, 530×; B, 415×;C, 365×; D, 125×; E, 210×; F, 190×; G, 360×.
Fig. 3.
Fig. 3.
Growth of pre-progenitor clusters, quantified by the MTT assay after 2 weeks in culture. A, Dose–response curve with optical density measurements (which represent total number of viable cells at each concentration) shows a dose-dependent increase in the proliferative response between 0.1 and 10 ng/ml FGF2 with the response leveling off above 10 ng/ml.B, Counting the number of MTT+ clusters in the tissue culture dish shows that 0.1 ng/ml FGF2 recruited the same number of cells to grow into cell clusters as 10 ng/ml. C, Cell cluster size was much larger with 10 ng/ml FGF2 than with 0.1 ng/ml.
Fig. 4.
Fig. 4.
T3 enhances the mitogenic effect of FGF2 on PSA-NCAM+ pre-progenitor cells. A, MTT colorimetric assay for quantitation of cell growth in various conditions. One representative assay (out of 3 experiments) is shown with mean ± SD of optical density measurement (n = 4 samples per condition). Neither T3 nor FGF2 alone stimulated growth but the combination of the two factors led to enhanced proliferation. PDGF induced similar growth as FGF2. B, TUNEL assay for apoptosis after 3 d in culture in various conditions. Values are the mean ± SEM of three experiments. T3 alone did not increase the percentage of TUNEL negative cells (i.e., living cells) as compared with control conditions. FGF2 alone caused a small (statistically nonsignificant) increase in survival. The combination of the two factors significantly increased survival (p= 0.075 as compared with FGF2 without T3). C, BrdU incorporation index after 3 d in culture. Values are mean ± SEM of three experiments. T3 alone was not mitogenic on its own. FGF2 alone slightly increased BrdU incorporation. The combination of FGF2 and T3 significantly and synergistically enhanced BrdU incorporation (p = 0.02 as compared with FGF2 without T3).D, Quantitation of MTT+ cell clusters observed in the dish after 1 week in culture. Values are the mean ± SEM of three experiments. Again, T3 did not induce cell cluster formation; FGF2 alone showed only a small increase in their number, but the combination of the factors caused a large increase in the number of cell clusters that were formed (p = 0.0003 as compared with FGF2 without T3).
Fig. 5.
Fig. 5.
Expression of thyroid hormone receptors (THRs) and FGF receptors (FGFRs) in pre-progenitor cells at various stages of growth and differentiation. RNA was isolated from PSA-NCAM+ cells immediately after immunopanning (panned cells) from clusters of pre-progenitors that were grown for 2 weeks in the presence of FGF2 and T3 (2wk clusters) and from clusters that were grown as above and then differentiated for 5 d in the presence of T3 and absence of FGF2 (diff. clusters). A, RT-PCR for THRα1, -α2, -β1, and -β2, and β-actin. Equally strong signal intensities of β-actin were detected in the various RNA preparations as shown in the right panel inA. Both isoforms of THRα and THRβ are detected in these RNA preparations. THRα1 and THRβ2 signals were decreased in differentiating cell clusters compared with immunopanned cells. THRα2 and -β1 signals are equally strong in all three cell preparations.B, RT-PCR for FGF receptors. FGFR1, FGFR2, and FGFR3 but not FGFR4 are expressed during the three developmental stages of pre-progenitor growth and development. SM, Molecular size marker (φx174 DNA digested withHaeIII).
Fig. 6.
Fig. 6.
Striatal neural stem cells grown in FGF2 for 7 d were differentiated for 5 d without FGF2. Spheres cultured with or without T3 were analyzed after triple label for 04/MAP2/GFAP, and the ratio of the different cell types was calculated (see Materials and Methods). Fewer neurons formed (**p < 0.001) and more oligodendrocytes emerged (*p < 0.05) in the presence of T3 than without. Three independent experiments were analyzed in the Student’st test.
Fig. 7.
Fig. 7.
Cell fate of PSA-NCAM-positive and -negative neonatal precursors grown in clusters/spheres with EGF or FGF2 and analyzed as in Figure 6. With each of these growth factors, PSA-NCAM immunopanned cells (panned) gave rise mostly to oligodendrocytes and astrocytes, whereas PSA-NCAM negative cells (unpanned) gave rise to the three CNS cell types. Within each growth factor group, the ratio of neuronal cells was significantly higher in unpanned cells (*p < 0.05). In the EGF group, the ratio of oligodendrocytes was significantly lower in unpanned than panned cells (*p < 0.05), whereas this significance was not reached in the FGF2 group (also see Fig. 6). Three independent experiments were analyzed in the Student’s ttest.

Similar articles

Cited by

References

    1. Ahlgren SC, Wallace H, Bishop J, Neophytou C, Raff MC. Effects of thyroid hormone on embryonic oligodendrocyte precursor cell development in vivo and in vitro. Mol Cell Neurosci. 1997;9:420–432. - PubMed
    1. Almazan G, Honegger P, Matthieu J-M. Triidothyronine stimulation of oligodendroglial differentiation and myelination. Dev Neurosci. 1985;7:45–54. - PubMed
    1. Alvarez-Dolado M, Iglesias T, Rodriguez-Pena A, Bernal J, Munoz A. Expression of neurotrophins and the trk family of neurotrophin receptors in normal and hypothyroid rat brain. Brain Res Mol Brain Res. 1994;27:249–257. - PubMed
    1. Armstrong RC, Harvath L, Dubois-Dalcq ME. Type 1 astrocytes and oligodendrocyte-type 2 astrocyte glial progenitors migrate toward distinct molecules. J Neurosci Res. 1990;27:400–407. - PubMed
    1. Avellana-Adalid V, Nait-Oumesmar B, Lachapelle F, Baron-Van Evercooren A. Expansion of rat oligodendrocyte progenitors into proliferative “oligospheres” that retain differential potential. J Neurosci Res. 1996;45:558–570. - PubMed

Publication types