Comparative Study
. 1998 Aug 1;18(15):5789-803.
doi: 10.1523/JNEUROSCI.18-15-05789.1998.

Readiness of zebrafish brain neurons to regenerate a spinal axon correlates with differential expression of specific cell recognition molecules

Affiliations
Comparative Study

Readiness of zebrafish brain neurons to regenerate a spinal axon correlates with differential expression of specific cell recognition molecules

T Becker et al. J Neurosci. .

Abstract

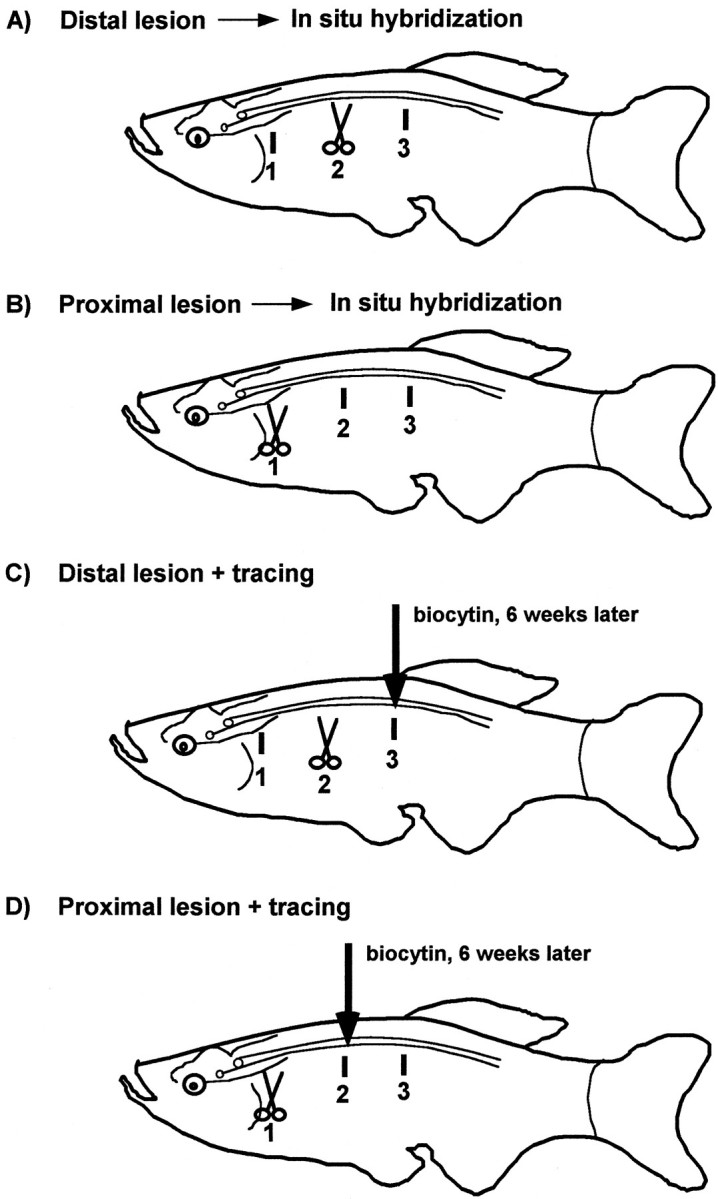
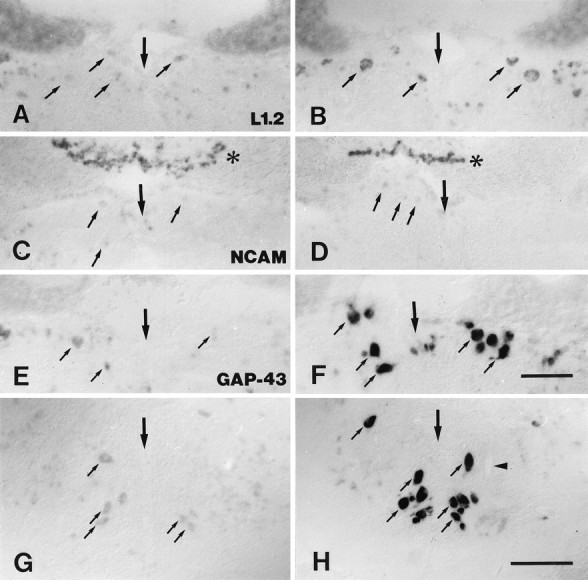
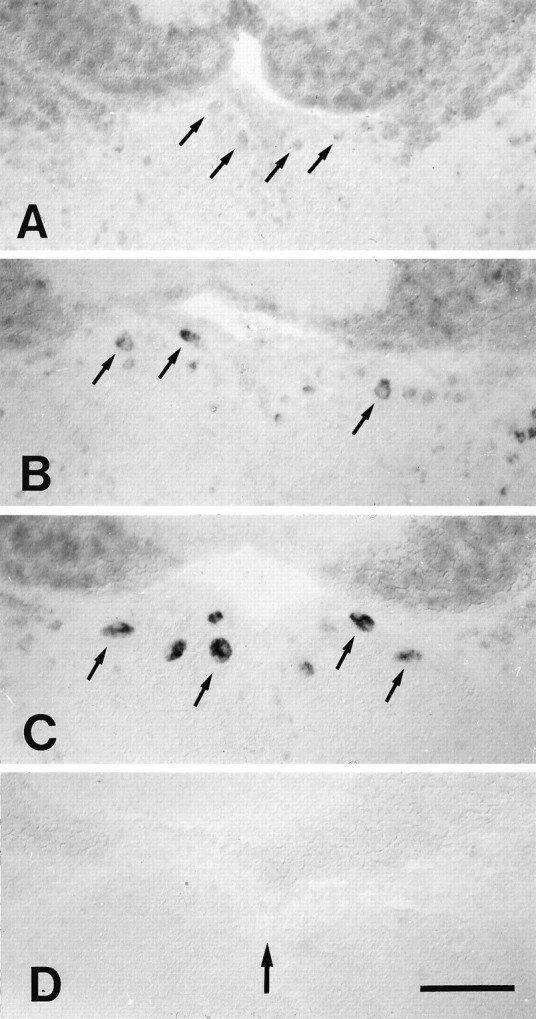
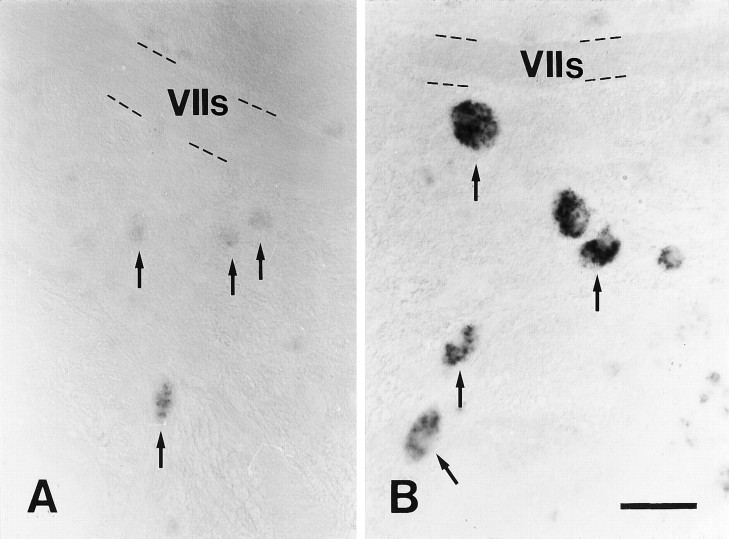
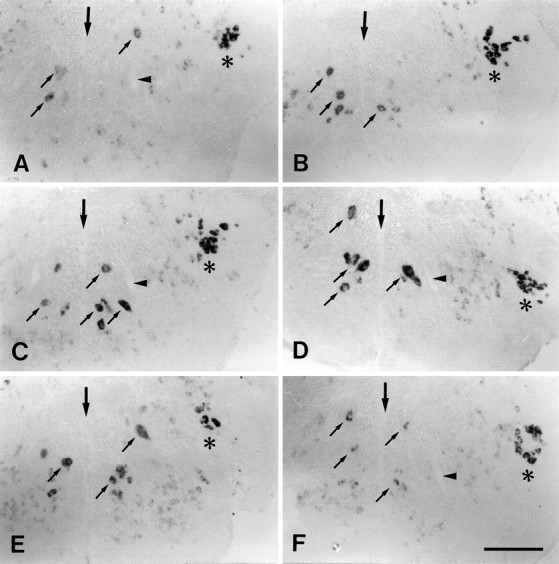
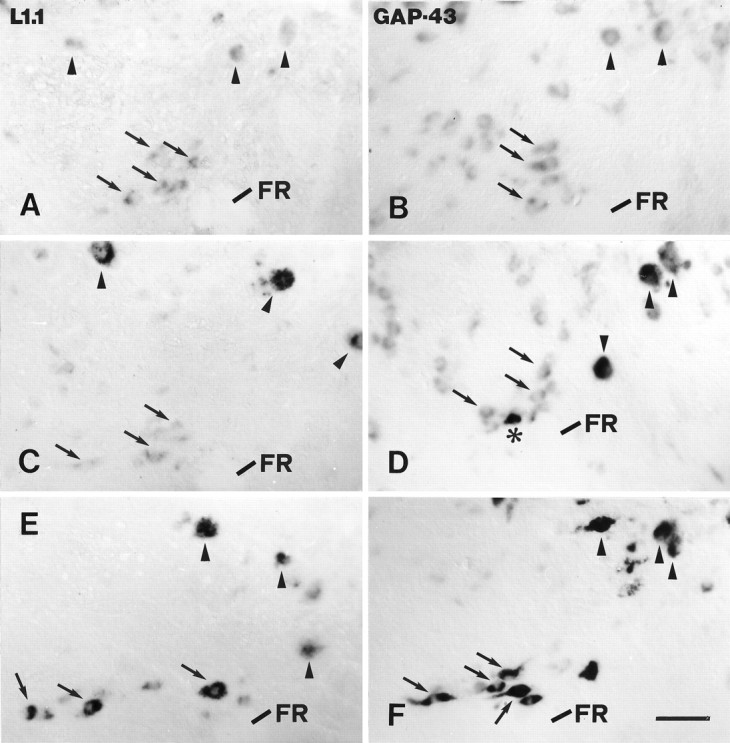
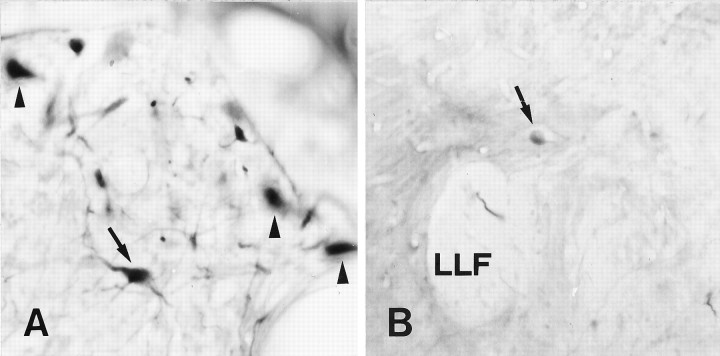
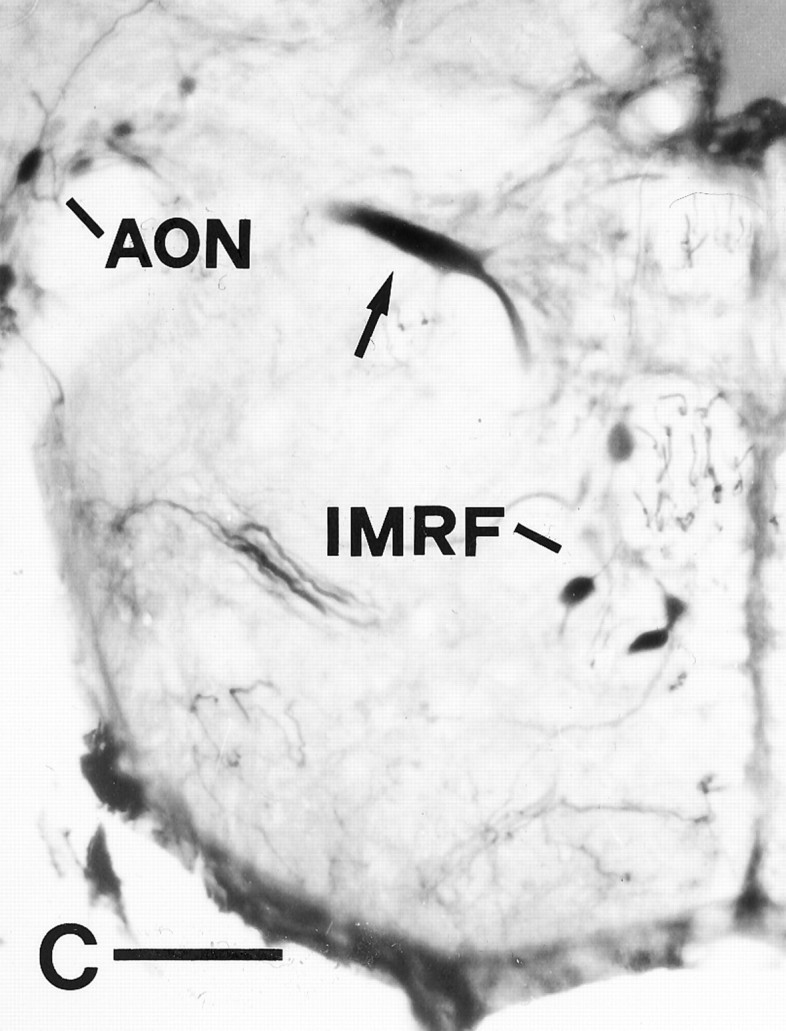
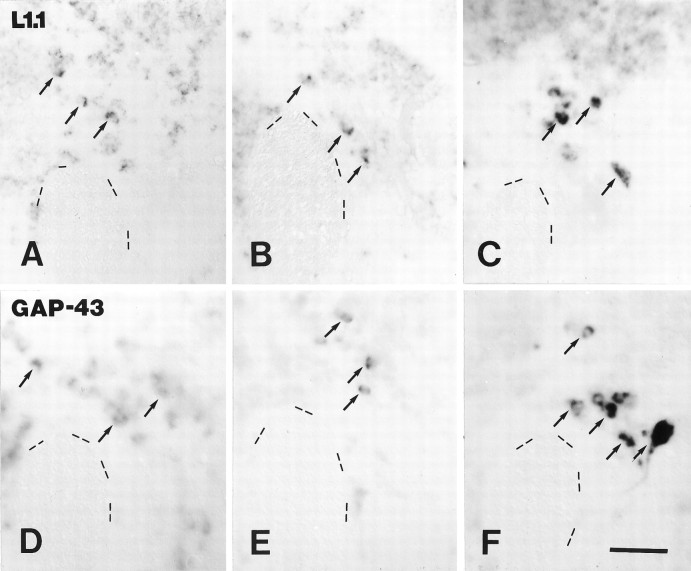
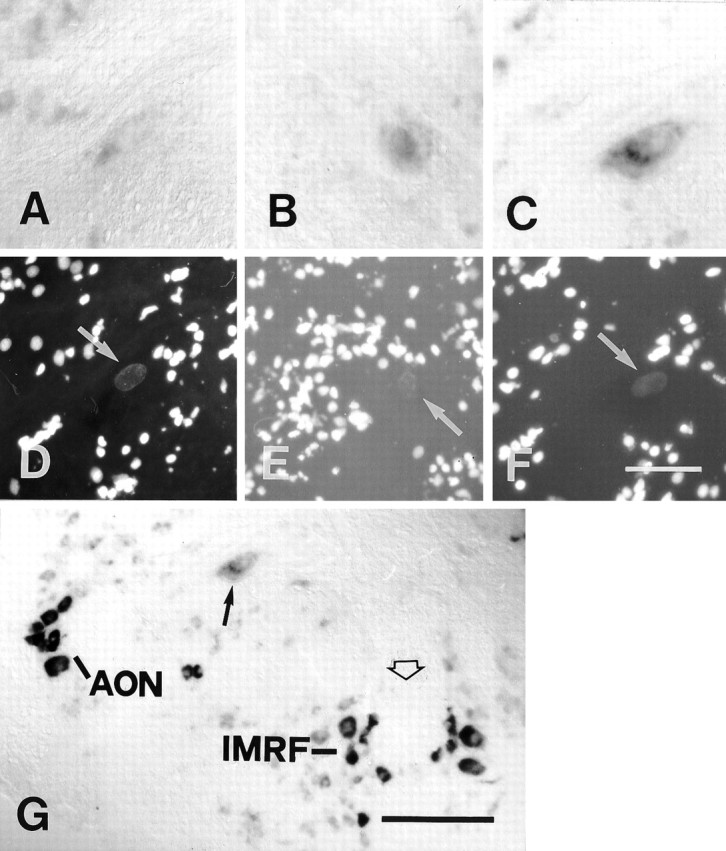
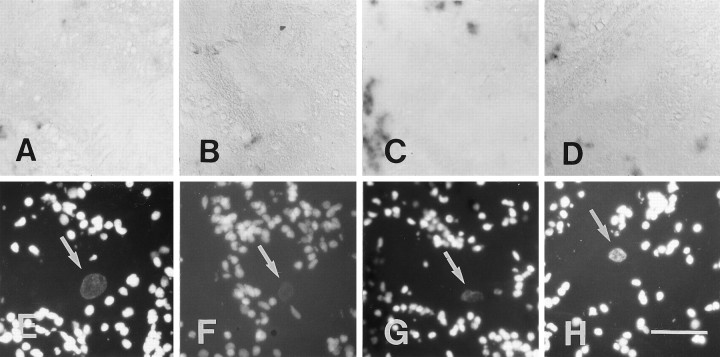
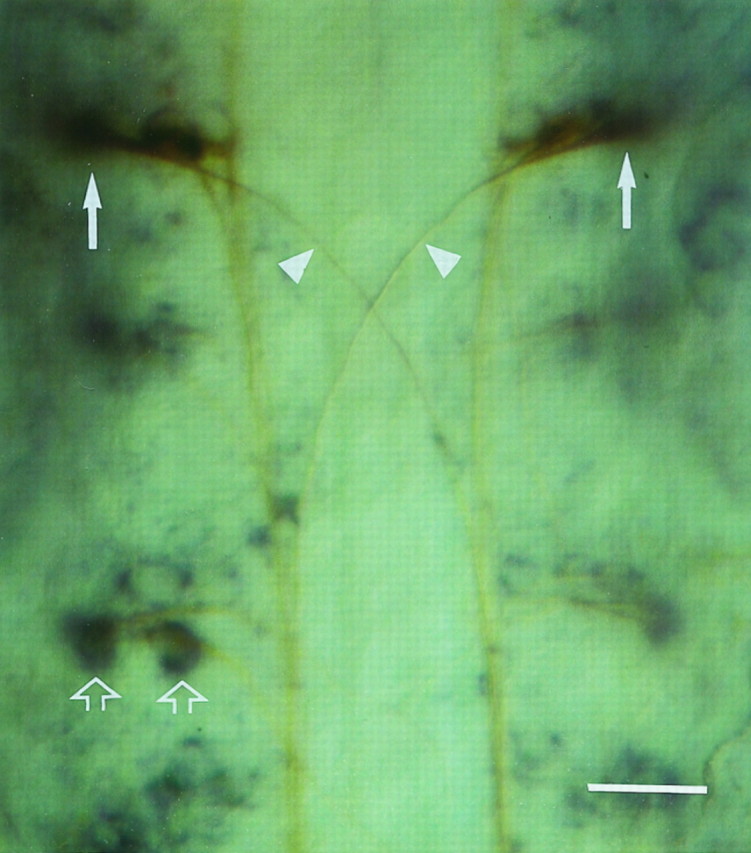
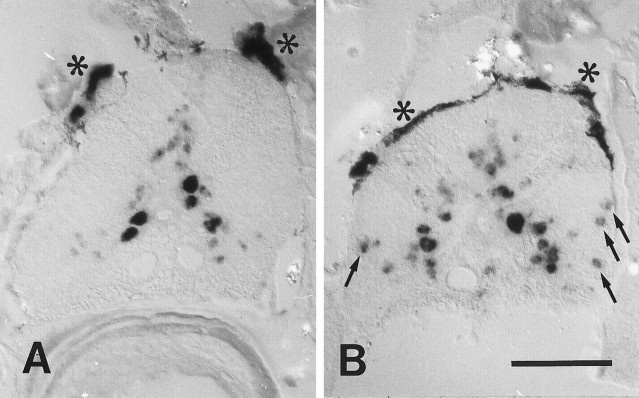
We analyzed changes in the expression of mRNAs for the axonal growth-promoting cell recognition molecules L1.1, L1.2, and neural cell adhesion molecule (NCAM) after a rostral (proximal) or caudal (distal) spinal cord transection in adult zebrafish. One class of cerebrospinal projection nuclei (represented by the nucleus of the medial longitudinal fascicle, the intermediate reticular formation, and the magnocellular octaval nucleus) showed a robust regenerative response after both types of lesions as determined by retrograde tracing and/or in situ hybridization for GAP-43. A second class (represented by the nucleus ruber, the nucleus of the lateral lemniscus, and the tangential nucleus) showed a regenerative response only after proximal lesion. After distal lesion, upregulation of L1.1 and L1.2 mRNAs, but not NCAM mRNA expression, was observed in the first class of nuclei. The second class of nuclei did not show any changes in their mRNA expression after distal lesion. After proximal lesion, both classes of brain nuclei upregulated L1.1 mRNA expression (L1.2 and NCAM were not tested after proximal lesion). In the glial environment distal to the spinal lesion, labeling for L1.2 mRNA but not L1.1 or NCAM mRNAs was increased. These results, combined with findings in the lesioned retinotectal system of zebrafish (Bernharnhardt et al., 1996), indicate that the neuron-intrinsic regulation of cell recognition molecules after axotomy depends on the cell type as well as on the proximity of the lesion to the neuronal soma. Glial reactions differ for different regions of the CNS.


Figures

Fig. 1.
Fig. 1.
A–D, Schematic representation of different experiments. Different lesion or tracing levels are indicated by numbers 1–3. A, B, To analyze changes in the expression of cell recognition molecules by in situ hybridization, spinal cords of fish were transected (scissors) either at level 2 (distal lesion, A) or at level 1 (proximal lesion, B). C, D, To assess regenerative success, 6 or more weeks after spinal cord transection, neurons in the brain were retrogradely labeled from level 3 after transection at level 2 (C) (published previously in Becker et al., 1997) or from level 2 after transection at level 1 (D).
Fig. 2.
Fig. 2.
A–H, Cerebrospinal projection nuclei differ in the expression of different mRNAs 14 d after distal spinal cord transection. Expression of L1.2 (A, B), NCAM (C, D), and GAP-43 (E–H) mRNAs in the nucleus of the medial longitudinal fascicle (A–F) and the intermediate reticular formation (G, H). All images are cross sections; dorsal is up. Large arrows indicate the brain midline. Small arrows point out individual neurons in the nucleus of the medial longitudinal fascicle (A–F) and in the intermediate reticular formation (G, H). A, B, Expression of L1.2 mRNA was increased in lesioned animals (B) as compared with unlesioned controls (A). C, D, NCAM mRNA expression was not increased in lesioned animals (D) as compared with unlesioned controls (C).Asterisks indicate the overlying Purkinje cells of the cerebellum that constitutively show intense NCAM mRNA labeling.E–H, In lesioned animals, there was a strong upregulation of GAP-43 mRNA expression in the nucleus of the medial longitudinal fascicle (F), compared with unlesioned control fish (E) and in the intermediate reticular formation (H), compared with unlesioned controls (G).Arrowhead in H points at a part of the ventral Mauthner cell dendrite. Scale bars: A–F (shown in F), 100 μm; G, H (shown inH), 150 μm.
Fig. 3.
Fig. 3.
A–D, Expression of L1.1 mRNA in the nucleus of the medial longitudinal fascicle was rapidly upregulated after distal spinal cord transection. All images are cross sections; dorsal is up. Small arrows indicate individual cells in the nucleus of the medial longitudinal fascicle. Large arrow in D indicates the position of the brain midline for all panels. A, In situlabeling was faint in unlesioned controls. B, Labeling was increased at 3 d post-lesion. C, In situ labeling was very strong at 14 d post-lesion.D, The L1.1 sense RNA probe showed no staining. Scale bar (shown in D for A–D): 100 μm.
Fig. 4.
Fig. 4.
A, B, L1.1 mRNA expression was strongly increased in the magnocellular octaval nucleus after distal spinal cord transection. All images are cross sections; dorsal is up, lateral is left. A, Unlesioned control;B, 14 d post-lesion. Arrows point to individual neurons in the magnocellular octaval nucleus. The sensory root of the facial nerve (VIIs) is indicated as an anatomical landmark. In situ labeling after spinal cord transection (B) was very strong, compared with unlesioned controls (A). Scale bar (shown inB for A and B): 50 μm.
Fig. 5.
Fig. 5.
A–F, Expression of L1.1 mRNA was increased between 3 and 56 d after distal lesion. All images are cross sections; dorsal is up. A, Unlesioned control;B, 3 d post-lesion; C, 7 d post-lesion; D, 14 d post-lesion; E, 56 d post-lesion; F, 84 d post-lesion.Large arrows indicate the midline of the brain.Small arrows point to individual cells in the intermediate reticular formation. Asterisks indicate the trigeminal motor nucleus, which constitutively shows intense labeling for L1.1 mRNA as an internal positive control.Arrowheads in A, C, D, andF indicate the ventral dendrite of the Mauthner cell as an additional landmark. A, Labeling was faint in unlesioned controls. B–E, Expression of L1.1 mRNA was increased between 3 and 56 d post-lesion. F, Staining intensity was similar to that in unlesioned controls at 84 d post-lesion (compare with A). Scale bar (shown in F for A–F): 150 μm.
Fig. 6.
Fig. 6.
A–F, Expression of L1.1 and GAP-43 mRNA in the nucleus ruber was not significantly upregulated after distal but was upregulated after proximal lesion. L1.1 (A, C, E) and GAP-43 (B, D, F) mRNA expression in the nucleus ruber in unlesioned control fish (A, B), 14 d after distal lesion (C, D), and 14 d after proximal lesion (E, F) are shown. All images are cross sections; dorsal is up, lateral is left. Arrows depict individual neurons of the nucleus ruber. Arrowheads indicate individual neurons of the nucleus of the medial longitudinal fascicle. The fasciculus retroflexus (FR) is indicated as an anatomical landmark. A, B, In unlesioned control fish, labeling for L1.1 (A) and GAP-43 mRNAs (B) was weak. C, D, After distal lesion, expression of L1.1 (C) and GAP-43 mRNAs (D) was not significantly upregulated in the nucleus ruber but was upregulated in the nucleus of the medial longitudinal fascicle. Asterisk in Dindicates one of the few cells in the nucleus ruber that was strongly labeled for GAP-43 mRNA after distal lesion (see Results). E, F, After proximal lesion, neurons in the nucleus ruber were strongly labeled for L1.1 (E) and GAP-43 mRNAs (F). The increase in L1.1 and GAP-43 mRNA expression in individual cells in the nucleus ruber (arrows) after proximal lesion (E, F) was comparable to the increase in the nucleus of the medial longitudinal fascicle (arrowheads). Scale bar (shown in F for A–F): 50 μm.
Fig. 7.
Fig. 7.
A–C, Retrograde axonal tracing (as described in Fig. 1) demonstrates axonal regrowth from the nucleus ruber, the nucleus of the lateral lemniscus, and the Mauthner cell after proximal lesion. All images are cross sections; dorsal is up, lateral is left. A, One neuron was labeled in the nucleus ruber (arrow), in addition to neurons in the nucleus of the medial longitudinal fascicle (arrowheads). B, Arrowdepicts one labeled neuron in the nucleus of the lateral lemniscus, in a dorsomedial position to the lateral longitudinal fascicle (LLF). C, The Mauthner cell (arrow) was retrogradely traced in addition to neurons in the anterior octaval nucleus (AON) and the intermediate reticular formation (IMRF). Scale bar (shown in C): A, B, 50 μm;C, 100 μm.
Fig. 7.
Fig. 7.
A–C, Retrograde axonal tracing (as described in Fig. 1) demonstrates axonal regrowth from the nucleus ruber, the nucleus of the lateral lemniscus, and the Mauthner cell after proximal lesion. All images are cross sections; dorsal is up, lateral is left. A, One neuron was labeled in the nucleus ruber (arrow), in addition to neurons in the nucleus of the medial longitudinal fascicle (arrowheads). B, Arrowdepicts one labeled neuron in the nucleus of the lateral lemniscus, in a dorsomedial position to the lateral longitudinal fascicle (LLF). C, The Mauthner cell (arrow) was retrogradely traced in addition to neurons in the anterior octaval nucleus (AON) and the intermediate reticular formation (IMRF). Scale bar (shown in C): A, B, 50 μm;C, 100 μm.
Fig. 8.
Fig. 8.
A–F, Expression of L1.1 and GAP-43 mRNAs in the nucleus of the lateral lemniscus was not significantly upregulated after distal but was upregulated after proximal lesion.In situ labeling of L1.1 (A–C) and GAP-43 (D–F) mRNAs, in unlesioned control fish (A, D), after distal (B, E) and proximal lesion (C, F) is shown. All images are cross sections; dorsal is up, lateral is left. Dashed lines outline the border of the lateral longitudinal fascicle as an anatomical landmark. Arrows point out individual cells in the nucleus of the lateral lemniscus. A–C, Labeling of L1.1 mRNA after distal lesion (B) was comparable to that in unlesioned controls (A), but it was strongly increased after proximal lesion (C). D–F, Intensity of labeling for GAP-43 mRNA was not increased after distal (E) but was increased after proximal lesion (F) as compared with unlesioned controls (D). Scale bar (shown in F forA–F): 50 μm.
Fig. 9.
Fig. 9.
A–G, Labeling for GAP-43 mRNA in the Mauthner cell was not significantly increased after distal and proximal lesion. All images are cross sections. A–C andG show in situ hybridization;D–F show nuclear fluorescence images corresponding toA–C and are included for orientation.Arrows in D–F point to the cell nucleus of the Mauthner cell. A, D, In an unlesioned control animal only weak in situ labeling was detected.B, E, At 14 d after a distal lesion, in situ labeling was faint. C, F, G, At 14 d after a proximal lesion, a slight increase in in situlabeling was seen occasionally (C, F). This increase appeared very weak, however, when compared with that in axotomized neurons that regenerated their axons consistently (seeG, a low-power view of the same section), i.e., the anterior octaval nucleus (AON) or the intermediate reticular formation (IMRF).Arrow in G points out the Mauthner cell, and the open arrow in G depicts the midline of the brain. Scale bar (shown in F forA–F): 50 μm; G, 150 μm.
Fig. 10.
Fig. 10.
A–H, No upregulation of L1.1 mRNA expression was observed for the Mauthner cell after distal and proximal lesion. All images are cross sections; A, E, unlesioned control; B, F, distal lesion, 3 d post-lesion; C, G, distal lesion, 7 d post-lesion; D, H, proximal lesion, 7 d post-lesion; E–H, the nuclear fluorescence images corresponding to A–D. Arrows point to the cell nucleus of the Mauthner cell. Staining intensity was extremely low in unlesioned controls (A, E), 3 d (B, F) and 7 d after distal lesion (C, G), as well as 7 d after proximal lesion (D, H). Scale bar (shown in H forA–H): 50 μm.
Fig. 11.
Fig. 11.
The Mauthner cell and other reticular projection neurons were strongly labeled for L1.1 mRNA during development. Whole-mount preparation shows expression of L1.1 mRNA in the Mauthner cells (arrows) and other reticular neurons (open arrows) in the brainstem of an embryonic zebrafish 27 hr after fertilization. Rostral is up. For identification of the Mauthner cells, the in situ hybridization (blue reaction product) was followed by immunohistochemistry with the antibody CON1 (brown reaction product). CON1 reveals the large decussating Mauthner axons (arrowheads). Scale bar, 25 μm.
Fig. 12.
Fig. 12.
A, B, L1.2 mRNA was upregulated in glial cells in the spinal white matter caudal to the lesion site. All images are cross sections; dorsal is up. Asterisksindicate melanocytes covering the dorsal aspect of the spinal cord.A, Unlesioned control; B, 14 d post-lesion. Labeling of L1.2 mRNA was increased in small cells in the white matter (B, arrows) and in cells in the gray matter in the spinal cord caudal to a distal lesion (B) as compared with unlesioned controls (A). Scale bar (shown in B): 100 μm.

References

    1. Aigner L, Arber S, Kapfhammer JP, Laux T, Schneider C, Botteri F, Brenner HR, Caroni P. Overexpression of the neural growth-associated protein GAP-43 induces nerve sprouting in the adult nervous system of transgenic mice. Cell. 1995;83:269–278. - PubMed
    1. Ajemian A, Ness R, David S. Tenascin in the injured rat optic nerve and in non-neuronal cells in vitro: potential role in neural repair. J Comp Neurol. 1994;340:233–242. - PubMed
    1. Appel F, Holm J, Conscience JF, Schachner M. Several extracellular domains of the neural cell adhesion molecule L1 are involved in neurite outgrowth and cell body adhesion. J Neurosci. 1993;13:4764–4775. - PMC - PubMed
    1. Bartsch U, Bartsch S, Dorries U, Schachner M. Immunohistological localization of tenascin in the developing and lesioned adult mouse optic nerve. Eur J Neurosci. 1992;4:338–352. - PubMed
    1. Bastmeyer M, Schlosshauer B, Stürmer CAO. The spatio-temporal distribution of N-CAM in the retinotectal pathway of adult goldfish detected by the monoclonal antibody D3. Development. 1990;108:299–311. - PubMed

Publication types