. 1998 Jul 21;95(15):8544-9.
doi: 10.1073/pnas.95.15.8544.

The exocyclic groups of DNA modulate the affinity and positioning of the histone octamer

Affiliations

The exocyclic groups of DNA modulate the affinity and positioning of the histone octamer

M Buttinelli et al. Proc Natl Acad Sci U S A. .

Abstract

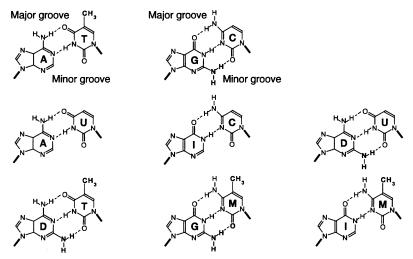
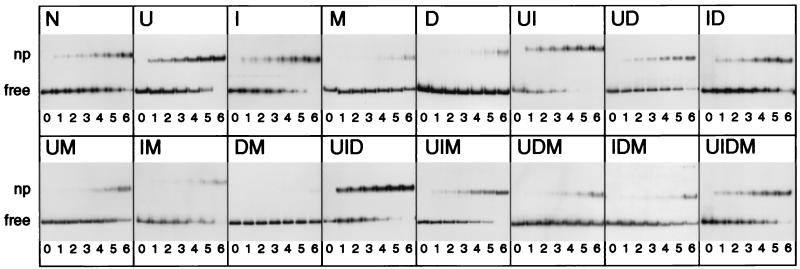
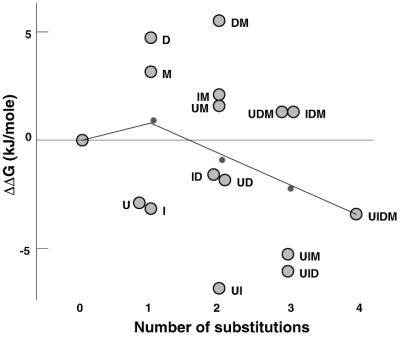
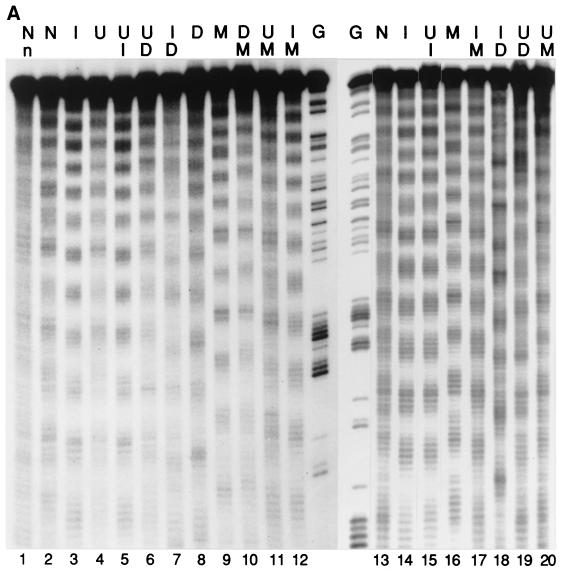
To investigate the nature of the chemical determinants in DNA required for nonspecific binding and bending by proteins we have created a novel DNA in which inosine-5-methylcytosine and 2, 6-diaminopurine-uracil base pairs are substituted for normal base pairs in a defined DNA sequence. This procedure completely switches the patterns of the base pair H bonding and attachment of exocyclic groups. We show that this DNA binds a histone octamer more tightly than normal DNA but, surprisingly, does not alter the orientation of the sequence on the surface of the protein. However, in general, the addition or removal of DNA exocyclic groups reduces or increases, respectively, the affinity for the histone octamer. The average incremental change in binding energy for a single exocyclic group is approximately 40 J/mol. The orientation of the DNA in core nucleosomes also is sensitive to the number and nature of the exocyclic groups present. Notably, substitution with the naturally occurring cytosine analogue, 5-methylcytosine, shifts the preferred rotational position by 3 bp, whereas incorporating 2,6-diaminopurine shifts it 2 bp in the opposite direction. These manipulations potentially would alter the accessibility of a protein recognition sequence on the surface of the histone octamer. We propose that exocyclic groups impose steric constraints on protein-induced DNA wrapping and are also important in determining the orientation of DNA on a protein surface. In addition, we consider the implications of the selection of A-T and G-C base pairs in natural DNA.


Figures

Figure 1
Figure 1
Structural formulae of the eight different purine⋅pyrimidine base pairs between the natural (A, T, G, C) and exocyclic-modified (U, I, D, M) bases used. A, T, G, and C indicate, respectively, 2′-deoxyadenosine, 2′-deoxythymidine, 2′-deoxyguanosine, and 2′-deoxycytidine, and U, I, D, and M indicate 2′-deoxyuridine, 2′-deoxyinosine, 2,6-diaminopurine-2′-deoxyriboside, and 2′-deoxy-5-methylcytidine. The deoxyribose is represented by a thick bar corresponding to its bonding at positions N9 and N1 of purines and pyrimidines, respectively. The 5-methyl and 2-amino exocyclic groups are shown in bold.
Figure 2
Figure 2
Addition of DNA exocyclic groups reduces and their removal increases the affinity of the tyrT-containing DNA fragment for histone octamer as determined by a competitor titration experiment using bandshift assays. 5′ end-labeled 160-bp tyrT DNA fragments (17) containing natural or modified bases (Fig. 1) were produced according to a PCR amplification procedure (described in ref. with modifications) designed to minimize the concentration of end-labeled specific DNA in the assembling mixture and to increase its specific activity for binding studies and hydroxyl-radical footprinting, respectively. Nucleosome particles (nps) were assembled on labeled specific DNA by using a salt-dilution protocol (10) with H1-stripped long chromatin acting as a histone octamer donor and different amounts of bulk core-nucleosomal DNA as competitor DNA. Representative gels of the reconstitution of core particles at 22°C from all 16 substituted variants of tyrT are shown. Letters above gels refer to the type and number of substitutions present (see Fig. 1 for reference and abbreviations). Corresponding to numbers 1, 2, 3, 4, 5, and 6 below the gels, 11, 8, 5, 2, 1, and 0 μg of competitor DNA were added before salt dilution to a constant amount of labeled specific DNA and H1-stripped long chromatin. A control experiment also was carried out by salt dilution on DNA alone (lane 0). Positions of 160-bp tyrT DNA fragment either as complexed with histone octamer (np) or unbound DNA (free) are indicated. N indicates unsubstituted DNA.
Figure 3
Figure 3
Difference between the free-energy change (ΔΔGm−N°) at 22°C for binding of the substituted (m) and unsubstituted (N) DNA species to the histone. The number of bases substituted is plotted on the abscissa (i.e., 0 substitution: unmodified DNA). Abbreviations for modified DNAs are as for Fig. 1. The median values of the mono-, di-, and trisubstituted DNA species also are plotted (thick line). Data from at least three gels for each DNA were averaged to determine the free-energy difference.
Figure 4
Figure 4
Exocyclic groups affect the rotational positioning of nucleosomal particles (nps) in vitro. Nps were assembled onto 5′ labeled tyrT DNA fragments as described. All the samples were then subjected to cleavage by hydroxyl radical (24, 25), and the assembled nps with labeled specific DNA were purified by agarose gel electrophoresis. Then, DNAs were extracted and aliquots from the same sample were loaded onto different denaturing polyacrylamide gels. Typically, at least three np assembly reactions were performed for each DNA. Representative gel images are shown in A and B. The gel shown in A Left was a 6% polyacrylamide gel containing 8.3 M urea/1× TBE and contains 25% formamide to avoid band compression and thus facilitate the estimation of shifts in the rotational settings assumed by the different substituted DNAs on the histone octamer. All the other gels shown lacked formamide and also were cast by using wedge spacers (Bio-Rad) to highlight the periodicity and corresponding amplitudes of the hydroxyl-radical cleavage pattern. The nucleotide substitutions are specified as in Figs. 1 and 2. Images in A and B were spliced together using the full gel (A Left), a relevant part of gels (B), or a relevant lane from the same gel (A Right). For ease of comparison some substituted DNA species are included in more than one gel. In particular, the gel images in A and B are ordered to show the differences between substituted DNAs that adopt opposite rotational settings [D and M in lanes 8 and 9 (A) and ID and MU in lanes 12 and 13 (B); see also C]. n indicates the cleavage pattern of free DNA, and G indicates marker tracks showing the positions of guanine nucleotides in the sequence by using Maxam and Gilbert reaction. The asterisk in B indicates an artifactual band not generated by hydroxyl-radical cleavage. C shows scans of the samples shown in A Left. On the right-hand side of C the traces of the main harmonic of the Fourier transform are shown adjacent to the corresponding scan. The maximum amplitude values for each DNA from the scan shown were normalized to that of the unsubstituted DNA and are shown on the right-hand ordinate. The scale on the abscissa is in arbitrary units used by the geltrak program and is related to the gel-migration distance (26).
Figure 4
Figure 4
Exocyclic groups affect the rotational positioning of nucleosomal particles (nps) in vitro. Nps were assembled onto 5′ labeled tyrT DNA fragments as described. All the samples were then subjected to cleavage by hydroxyl radical (24, 25), and the assembled nps with labeled specific DNA were purified by agarose gel electrophoresis. Then, DNAs were extracted and aliquots from the same sample were loaded onto different denaturing polyacrylamide gels. Typically, at least three np assembly reactions were performed for each DNA. Representative gel images are shown in A and B. The gel shown in A Left was a 6% polyacrylamide gel containing 8.3 M urea/1× TBE and contains 25% formamide to avoid band compression and thus facilitate the estimation of shifts in the rotational settings assumed by the different substituted DNAs on the histone octamer. All the other gels shown lacked formamide and also were cast by using wedge spacers (Bio-Rad) to highlight the periodicity and corresponding amplitudes of the hydroxyl-radical cleavage pattern. The nucleotide substitutions are specified as in Figs. 1 and 2. Images in A and B were spliced together using the full gel (A Left), a relevant part of gels (B), or a relevant lane from the same gel (A Right). For ease of comparison some substituted DNA species are included in more than one gel. In particular, the gel images in A and B are ordered to show the differences between substituted DNAs that adopt opposite rotational settings [D and M in lanes 8 and 9 (A) and ID and MU in lanes 12 and 13 (B); see also C]. n indicates the cleavage pattern of free DNA, and G indicates marker tracks showing the positions of guanine nucleotides in the sequence by using Maxam and Gilbert reaction. The asterisk in B indicates an artifactual band not generated by hydroxyl-radical cleavage. C shows scans of the samples shown in A Left. On the right-hand side of C the traces of the main harmonic of the Fourier transform are shown adjacent to the corresponding scan. The maximum amplitude values for each DNA from the scan shown were normalized to that of the unsubstituted DNA and are shown on the right-hand ordinate. The scale on the abscissa is in arbitrary units used by the geltrak program and is related to the gel-migration distance (26).
Figure 5
Figure 5
Normalized Fourier amplitudes of hydroxyl-radical cleavage profiles for different substituted DNAs. The Fourier transform was calculated from densitometric profiles of the hydroxyl-radical cleavage patterns. Only the normalized amplitudes of the main harmonic are shown. The number of substitutions is specified on the abscissa as in Fig. 3. The values shown are the average of two determinations.

Similar articles

Cited by

References

    1. Yanagi K, Privé G G, Dickerson R E. J Mol Biol. 1991;217:201–214. - PubMed
    1. Hunter C A. J Mol Biol. 1993;230:1025–1054. - PubMed
    1. Young M A, Ravishanker G, Beveridge D L, Berman H M. Biophys J. 1995;68:2454–2468. - PMC - PubMed
    1. Gorin A A, Zhurkin V B, Olson W K. J Mol Biol. 1995;247:34–48. - PubMed
    1. El Hassan M A, Calladine C R. J Mol Biol. 1996;259:95–103. - PubMed

Publication types

LinkOut - more resources