A family of fatty acid transporters conserved from mycobacterium to man
- PMID: 9671728
- PMCID: PMC21126
- DOI: 10.1073/pnas.95.15.8625
A family of fatty acid transporters conserved from mycobacterium to man
Abstract
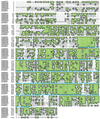
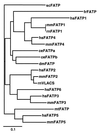
Long chain fatty acids (LCFAs) are an important source of energy for most organisms. They also function as blood hormones, regulating key metabolic functions such as hepatic glucose production. Although LCFAs can diffuse through the hydrophobic core of the plasma membrane into cells, this nonspecific transport cannot account for the high affinity and specific transport of LCFAs exhibited by cells such as cardiac muscle, hepatocytes, and adipocytes. Transport of LCFAs across the plasma membrane is facilitated by fatty acid transport protein (FATP), a plasma membrane protein that increases LCFA uptake when expressed in cultured mammalian cells [Schaffer, J. E. & Lodish, H. F. (1994) Cell 79, 427-436]. Here, we report the identification of four novel murine FATPs, one of which is expressed exclusively in liver and another only in liver and kidney. Both genes increase fatty acid uptake when expressed in mammalian cells. All five murine FATPs have homologues in humans in addition to a sixth FATP gene. FATPs are found in such diverse organisms as Fugu rubripes, Caenorhabditis elegans, Drosophila melanogaster, Saccharomyces cerevisiae, and Mycobacterium tuberculosis. The function of the FATP gene family is conserved throughout evolution as the C. elegans and mycobacterial FATPs facilitate LCFA uptake when overexpressed in COS cells or Escherichia coli, respectively. The identification of this evolutionary conserved fatty acid transporter family will allow us to gain a better understanding of the mechanisms whereby LCFAs traverse the lipid bilayer as well as yield insight into the control of energy homeostasis and its dysregulation in diseases such as diabetes and obesity.
Figures


References
-
- Weisburger J H. J Am Diet Assoc. 1997;97:S16–S23. - PubMed
-
- Chapus C, Rovery M, Sarda L, Verger R. Biochimie. 1988;70:1223–1234. - PubMed
-
- Green P H, Riley J W. Aust N Z J Med. 1981;11:84–90. - PubMed
-
- Scow R O, Blanchette-Mackie E J. Mol Cell Biochem. 1992;116:181–191. - PubMed
-
- Spector A A. Clin Physiol Biochem. 1984;2:123–134. - PubMed
Publication types
MeSH terms
Substances
Associated data
- Actions
- Actions
- Actions
- Actions
Grants and funding
LinkOut - more resources
Full Text Sources
Other Literature Sources
Molecular Biology Databases

