. 1998 Jul 21;95(15):8654-9.
doi: 10.1073/pnas.95.15.8654.

Targeted oncogenesis of hormone-negative pancreatic islet progenitor cells

Affiliations

Targeted oncogenesis of hormone-negative pancreatic islet progenitor cells

T L Jetton et al. Proc Natl Acad Sci U S A. .

Abstract

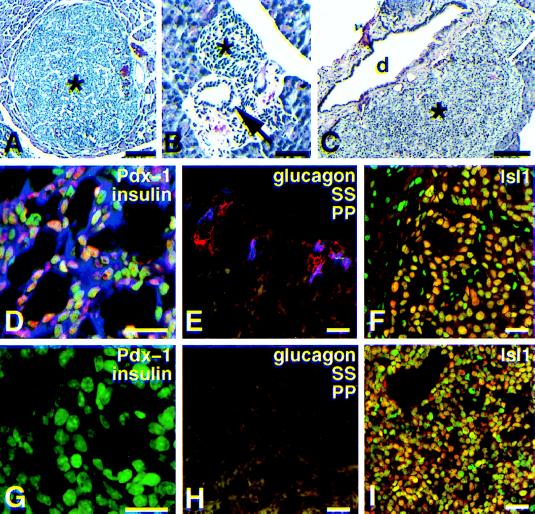
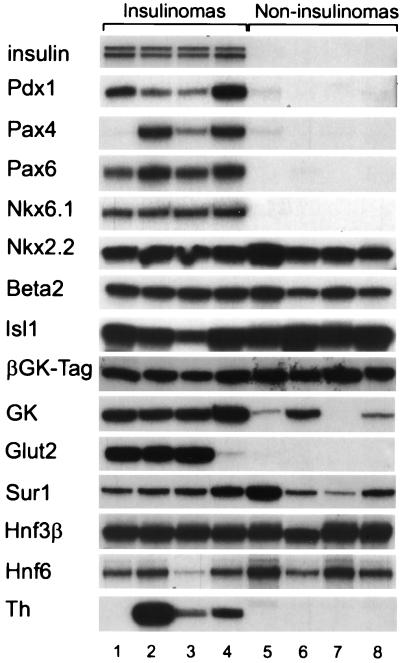
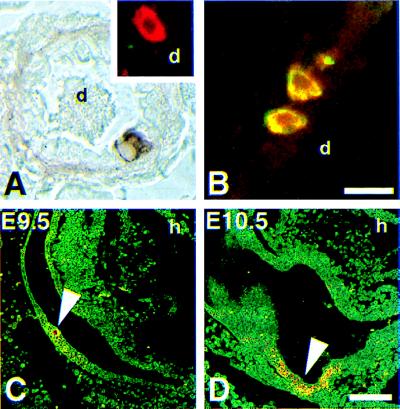
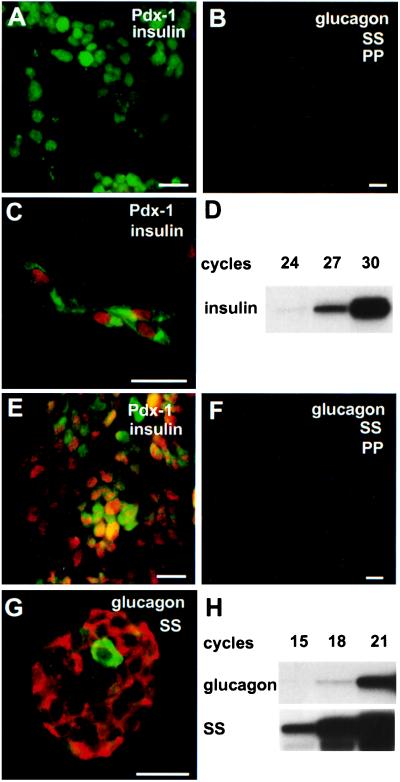
Transgenic mice containing an upstream glucokinase (betaGK) promoter- simian virus 40 T antigen (Tag) fusion gene develop neuroendocrine tumors primarily in the pancreas, gut, and pituitary. Pancreatic tumors from a line with delayed tumorigenesis were of two different types: insulinomas and noninsulinomas. The noninsulinomas are often periductal in location, express none of the four major islet peptide hormones, Glut-2, Pdx1, tyrosine hydroxylase, Pax4, Pax6, or Nkx6.1, but do express glucokinase, Sur1, Isl1, Hnf3beta, Hnf6, Beta2/NeuroD, and Nkx2.2. Cells from two different noninsulinoma tumors, when adapted to culture, began to express either insulin, glucagon, or somatostatin. Given the partial gene expression repertoire of the noninsulinoma tumors, their apparent periductal origin, and the ability of these cells to partially cytodifferentiate in culture, we suggest that these tumors are derived from islet progenitor cells. Thus, betaGK-Tag transgenic mice provide a new model system for studying the events that occur during both islet cell neogenesis and normal embryonic development.


Figures

Figure 1
Figure 1
Histologic and immunochemical characterization of βGK−1000/+14–Tag pancreatic tumors. (A–C) Hematoxylin–eosin stained. (D–I) Confocal fluorescence imaging. (A) Overview of pancreas from βGK−1000/+14–Tag adult mouse showing a typical insulinoma (∗). (Bar, 100 μm.) (B) A periductal aggregate (∗) of hyperplastic epithelial cells, probably representing an early noninsulinoma tumor. A pancreatic duct is indicated by an arrow. (Bar, 50 μm.) (C) Noninsulinoma tumors (∗) were as prevalent as insulinomas, but more often observed near pancreatic ducts (d). (Bar, 0.2 μm). (D) Triple-stained insulinoma showing nuclear Pdx-1 immunoreactivity (orange nuclear color) in most insulin-positive cells (blue). Chromatin is stained green, which results in light green to bright orange color depending on the relative levels of Pdx-1. (Bar, 20 μm.) (E) Insulinoma stained for glucagon (blue), somatostatin (SS) (red), and pancreatic polypeptide (PP; green). Only a few cells located at the tumor periphery stain for these non-β cell markers. (Bar, 20 μm). (F) Insulinoma stained for Isl1 (orange nuclei). Nuclei are counterstained green. (Bar, 20 μm.) (G) Triple-stained undifferentiated tumor (compare with D) demonstrating lack of both PDX-1 and insulin immunoreactivity. Nuclei are counterstained green. (Bar, 20 μm.) (H) Lack of staining for peptide hormones in a noninsulinoma tumor (compare with E). (Bar, 20 μm.) (I) Noninsulinoma stained for Isl1 (orange; compare with insulinoma in F). Nuclei are counterstained green. Almost every cell in both the insulinomas and noninsulinomas stained for Isl1. (Bar, 20 μm.)
Figure 2
Figure 2
RT–PCR characterization of gene expression in insulinomas and islet precursor cell (noninsulinoma) tumors from βGK–Tag mice. The RT–PCR amplification pattern of the indicated gene products are shown for eight different tumors, four of which were classified as insulinomas (lanes 1–4) and four as noninsulinomas (lanes 5–8) based on insulin immunostaining (Fig. 1). The insulinomas generally contained insulin (insulin II-top band, insulin I-bottom band), Pdx1, Pax4, Pax6, Nkx6.1, tyrosine hydroxylase (Th), and Glut-2 mRNAs, which were are not present in noninsulinoma tumors. Nkx2.2, Beta2/NeuroD, Isl1, simian virus 40 Tag, Sur1, GK, Hnf3β, and Hnf6 mRNAs were present in both tumor types.
Figure 3
Figure 3
βGK−280/+14 transgene expression in pancreatic and presumptive islet rudiments in mice. (A and B) Immunofluorescence analysis of rare ductal cells that express βGK−280/+14–hGH transgene. (C and D) Whole-mount in situ hybridization of staged mouse embryos for GK mRNA. (A) βGK−280/+14–hGH is expressed in rare isolated cells and small clusters within the pancreatic duct (d) epithelium in adult mice. (Inset) Confocal image of a hGH-positive cell (red) proximal to a small ductule (d) that has been costained, but is negative for both insulin and glucagon. A pink, yellow, or whitish color would have indicated insulin and/or glucagon expression. (B) βGK−280/+14–hGH-expressing NE cells (red) along the duct (d) epithelia also stain for PYY (green) as revealed by their yellow emission. PYY immunoreactivity is restricted to α cells in adult islets (19). (Bar, 20 μm.) (C) Computer-enhanced reverse image of a mid-sagittal section through an E9.5 day embryo reveals a small cluster of hybridization signal (arrow) associated with thickened foregut epithelium in area destined to become dorsal pancreatic bud. Eosin counterstain. Heart (h) is indicated for reference. (D) Comparable section through an E10.5 day embryo showing hybridization signal (arrow) associated with dorsal pancreatic bud. GK mRNA was absent in liver rudiments in these early stages. (Bar, 100 μm.)
Figure 4
Figure 4
Cytodifferentiation of islet hormone-negative tumor cells in culture. (A–C and E–G) Confocal immunofluorescence analysis of tumors 5236C and 5230B and derived cells. (D and H) RT–PCR analysis of total RNA. (A) Lack of either insulin (blue) or Pdx-1 (red-orange) in section of tumor 5236C stained for both proteins. Neither insulin or Pdx-1 is expressed in this tumor. Nuclei are counterstained green. (B) Triple staining of tumor 5236C for glucagon (blue), somatostatin (SS, red), and pancreatic polypeptide (PP, green). Expression of these islet hormones was not detected, as was typical for almost all of the noninsulinomas. (C) Double staining for insulin (green) and Pdx-1 (red) of cells from this tumor after 16 wk in culture. Coexpression of insulin with Pdx-1 is seen in several cells. (D) RT–PCR confirming the expression of insulin I mRNA in total RNA isolated from cells derived from tumor 5236C. (E) Section of tumor 5230B, stained in the same way as A, showing expression of Pdx-1 but not insulin as judged by the red-orange nuclear signal and lack of a blue signal. (F) Triple staining of tumor 5230B, as in B, demonstrating the lack of glucagon, somatostatin, or PP immunoreactivity in the tumor at the time of necropsy. (G) Dual staining for glucagon (green) and somatostatin (red) of cells derived from tumor 5230B after 24 wk in culture. Almost all of the cultured tumor cells were found to express somatostatin, although rare glucagon-expressing cells were also observed. (H) RT–PCR showing presence of somatostatin and glucagon mRNAs in total RNA from cells derived from this tumor. (Bars, 20 μm.)

References

    1. LeDouarin N M. Cell. 1988;53:169–171. - PubMed
    1. Alpert S D, Hanahan D, Teitelman G. Cell. 1988;53:295–308. - PubMed
    1. Gu D, Sarvetnick N. Development. 1993;118:33–46. - PubMed
    1. Bonner-Weir S, Baxter L A, Schuppin G T, Smith F E. Diabetes. 1993;42:1715–1720. - PubMed
    1. Rafaeloff R, Pittenger G L, Barlow S W, Qin X F, Yan B, Rosenberg L, Duguid W P, Vinik A I. J Clin Invest. 1997;99:2100–2109. - PMC - PubMed

Publication types