

Frontotemporal cerebral blood flow change during executive and declarative memory tasks in schizophrenia: a positron emission tomography study
- PMID: 9673996
- PMCID: PMC4440491
- DOI: 10.1037//0894-4105.12.3.399
Frontotemporal cerebral blood flow change during executive and declarative memory tasks in schizophrenia: a positron emission tomography study
Abstract
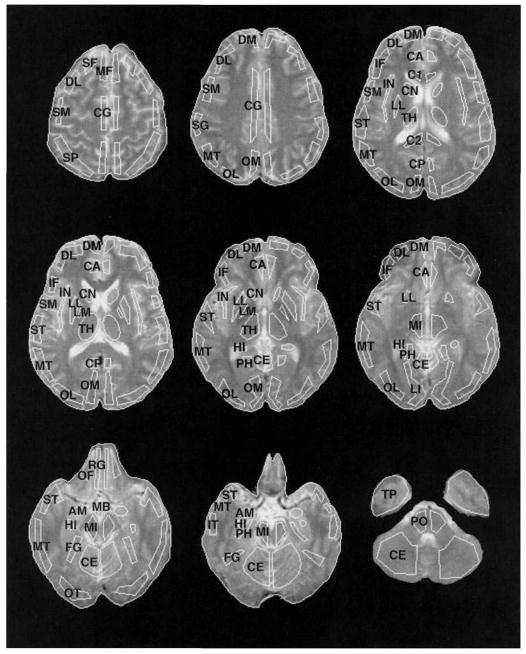
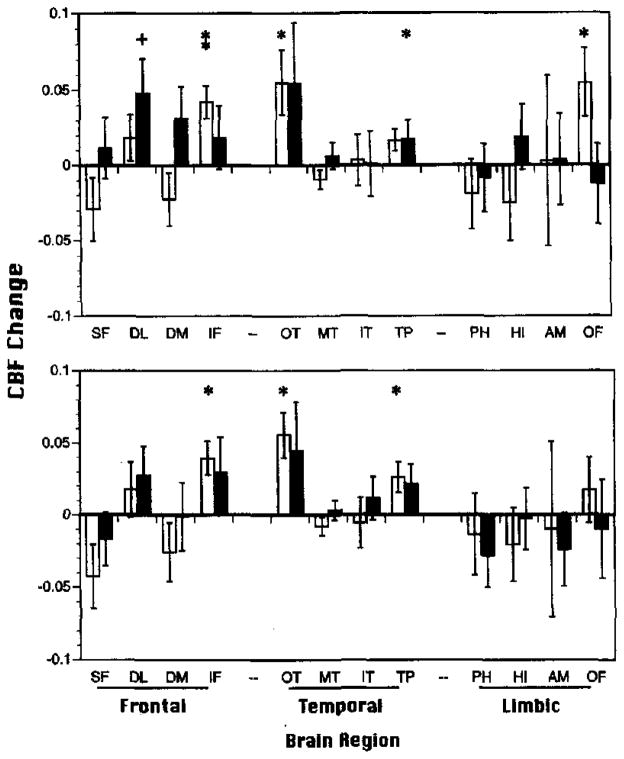
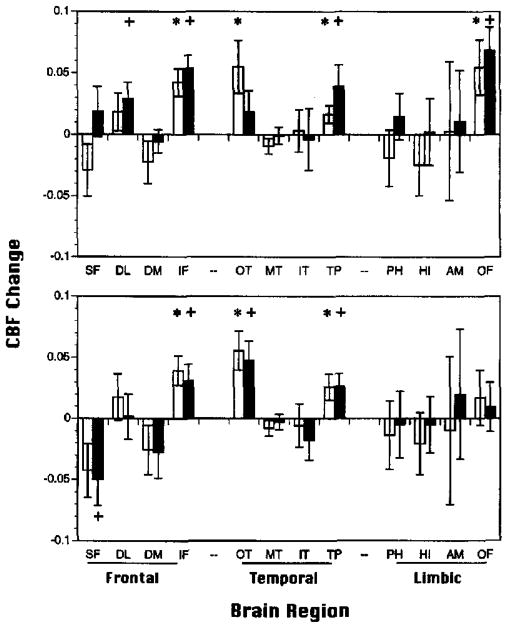
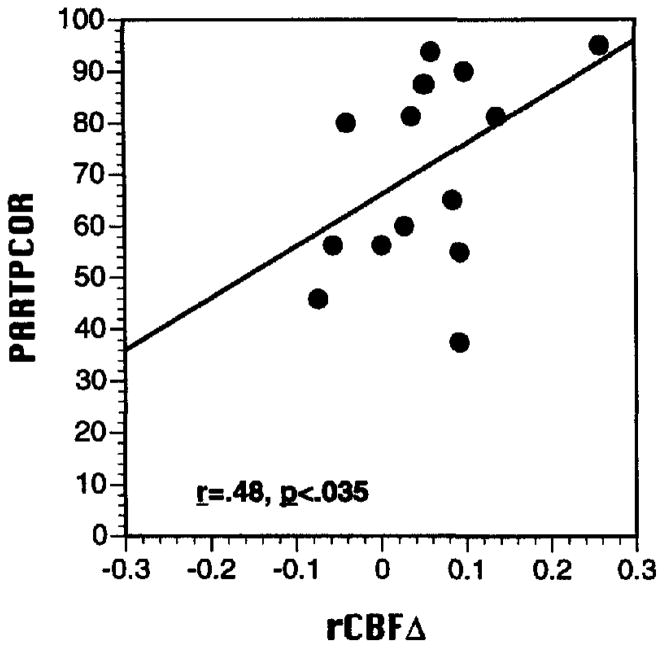
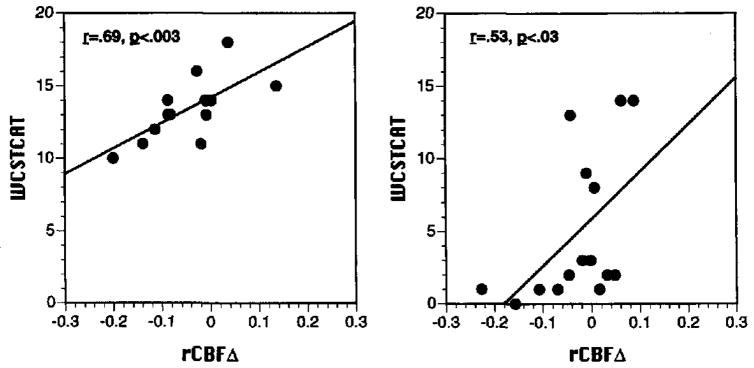
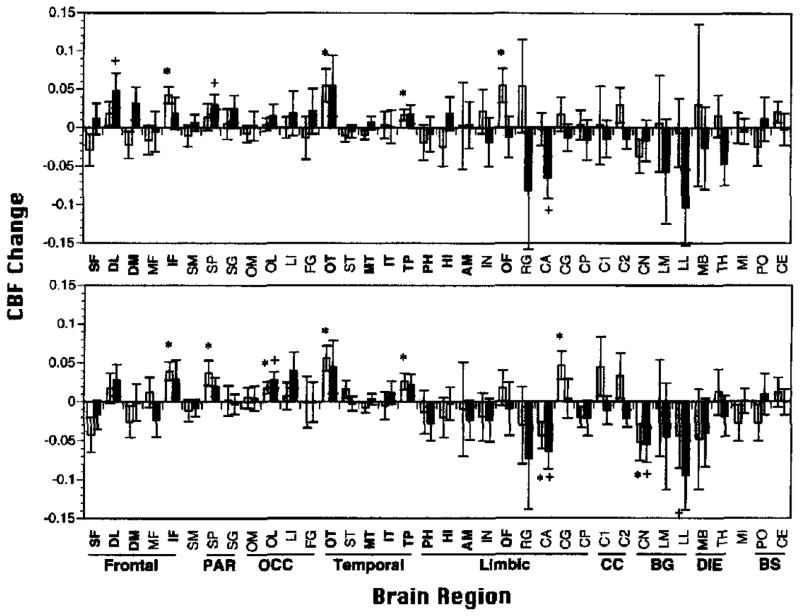
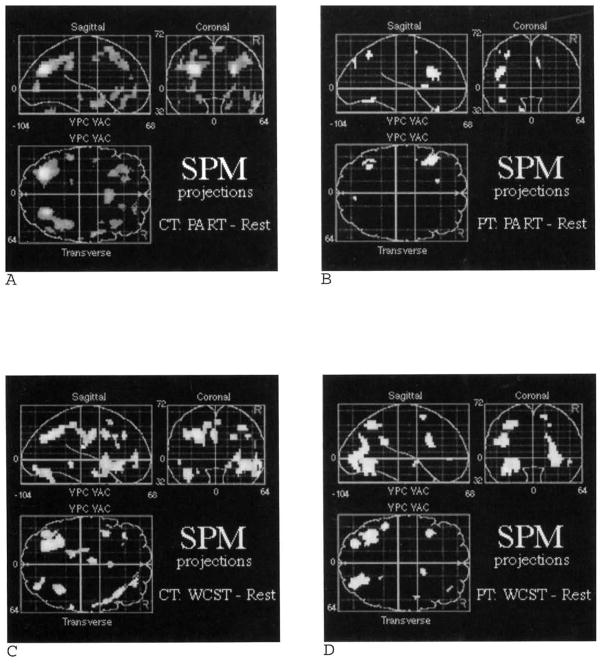
Schizophrenia affects prefrontal and temporal-limbic networks. These regions were examined by contrasting regional cerebral blood flow (rCBF) during executive (Wisconsin Card Sorting Test [WCST]), and declarative memory tasks (Paired Associate Recognition Test [PART]). The tasks, and a resting baseline, were administered to 15 patients with schizophrenia and 15 healthy controls during 10 min positron emission tomography 15O-water measures of rCBF. Patients were worse on both tasks. Controls activated inferior frontal, occipitotemporal, and temporal pole regions for both tasks. Similar results were obtained for controls matched to level of patient performance. Patients showed no activation of hypothesized regions during the WCST and activated the dorsolateral prefrontal cortex during the PART. On the PART, occipitotemporal activation correlated with better performance for controls only. Better WCST performance correlated with CBF increase in prefrontal regions for controls and in the parahippocampal gyrus for patients. Results suggest that schizophrenia may involve a breakdown in the integration of a frontotemporal network that is responsive to executive and declarative memory demands in healthy individuals.
Figures
Similar articles
-
Effect of schizophrenia on frontotemporal activity during word encoding and recognition: a PET cerebral blood flow study.Am J Psychiatry. 2001 Jul;158(7):1114-25. doi: 10.1176/appi.ajp.158.7.1114. Am J Psychiatry. 2001. PMID: 11431234 Free PMC article.
-
PET regional cerebral blood flow change during working and declarative memory: relationship with task performance.Neuropsychology. 1997 Apr;11(2):222-31. doi: 10.1037//0894-4105.11.2.222. Neuropsychology. 1997. PMID: 9110329 Free PMC article.
-
Neuroimaging of cognitive disability in schizophrenia: search for a pathophysiological mechanism.Int Rev Psychiatry. 2007 Aug;19(4):417-27. doi: 10.1080/09540260701486365. Int Rev Psychiatry. 2007. PMID: 17671874 Free PMC article. Review.
-
Sex differences in brain-behavior relationships between verbal episodic memory and resting regional cerebral blood flow.Neuropsychologia. 2000;38(4):451-61. doi: 10.1016/s0028-3932(99)00086-x. Neuropsychologia. 2000. PMID: 10683395 Free PMC article. Clinical Trial.
-
The frontal lobes, basal ganglia, and temporal lobes as sites for schizophrenia.Schizophr Bull. 1990;16(3):379-89. doi: 10.1093/schbul/16.3.379. Schizophr Bull. 1990. PMID: 2287929 Review.
Cited by
-
Effect of schizophrenia on frontotemporal activity during word encoding and recognition: a PET cerebral blood flow study.Am J Psychiatry. 2001 Jul;158(7):1114-25. doi: 10.1176/appi.ajp.158.7.1114. Am J Psychiatry. 2001. PMID: 11431234 Free PMC article.
-
Executive function, neural circuitry, and genetic mechanisms in schizophrenia.Neuropsychopharmacology. 2010 Jan;35(1):258-77. doi: 10.1038/npp.2009.111. Neuropsychopharmacology. 2010. PMID: 19693005 Free PMC article. Review.
-
Neurocomputational Nosology: Malfunctions of Models and Mechanisms.Front Psychol. 2016 May 3;7:602. doi: 10.3389/fpsyg.2016.00602. eCollection 2016. Front Psychol. 2016. PMID: 27199835 Free PMC article. Review.
-
Striatal activity in concept learning.Cogn Affect Behav Neurosci. 2002 Jun;2(2):149-61. doi: 10.3758/cabn.2.2.149. Cogn Affect Behav Neurosci. 2002. PMID: 12455682
-
Increased CNS levels of apolipoprotein D in schizophrenic and bipolar subjects: implications for the pathophysiology of psychiatric disorders.Proc Natl Acad Sci U S A. 2001 Mar 27;98(7):4066-71. doi: 10.1073/pnas.071056198. Proc Natl Acad Sci U S A. 2001. PMID: 11274430 Free PMC article.
References
-
- Alexander GE, Furey ML, Grady CL, Pietrini P, Brady DR, Mentis MJ, Schapiro MB. Association of premorbid intellectual function with cerebral metabolism in Alzheimer’s disease: Implications for the cognitive reserve hypothesis. American Journal of Psychiatry. 1997;154:165–172. - PubMed
-
- American Psychiatric Association. Diagnostic and statistical manual of mental disorders. 4. Washington, DC: Author; 1994.
-
- Andreasen NC. Negative symptoms in schizophrenia: Definition and reliability. Archives of General Psychiatry. 1982a;39:784–788. - PubMed
-
- Andreasen NC. Negative vs. positive schizophrenia: Definition and validation. Archives of General Psychiatry. 1982b;39:789–798. - PubMed
-
- Andreasen NC, O’Leary DS, Cizadlo T, Arndt S, Rezai K, Boles Ponto LL, Watkins GL, Hichwa RD. Schizophrenia and cognitive dysmetria: A positron-emission tomography study of dysfunctional prefrontal-thalamic-cerebellar circuitry. Proceedings of the National Academy of Sciences, USA. 1996;93:9985–9990. - PMC - PubMed
